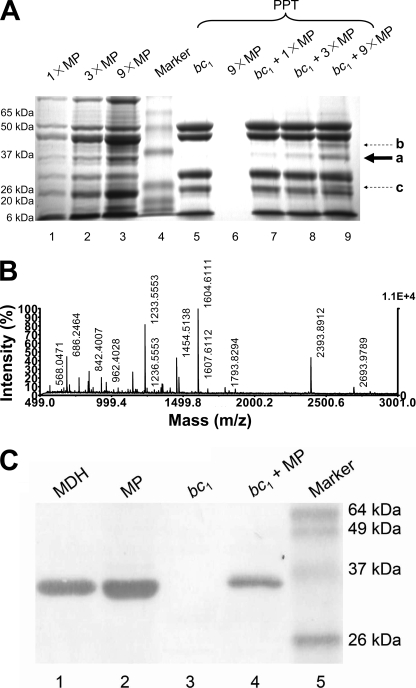
FIGURE 1.
Identification of MDH as an interacting protein with the bc1 complex. A, SDS-PAGE analysis of bc1 pulled-down proteins from matrix extract. Lanes 1-3, various amounts of MP as controls show the proteins in the matrix extract; lane 4, standard proteins; lanes 5 and 6, bc1 complex and MP only as controls show the precipitates after centrifugation; lanes 7-9, shown is the bc1 complex together with the pulled-down proteins from matrix extract. The solid arrow shows the main matrix protein being pulled down by the bc1 complex. The dashed arrow shows some other bands being pulled down by the bc1 complex. MP stands for mitochondrial matrix proteins; 1×, 3×, and 9× stand for 0.28, 0.83, and 2.50 mg/ml of MP in the experiment. PPT stands for precipitates. a, malate dehydrogenase; b, aspartate transaminase; c, unknown protein. B, shown are mass spectrometry spectra of protein sliced from SDS-PAGE gel. Spectrum data were collected from a MALDI-TOF mass spectrometer. It consisted of a series of multiple charged ions from each fragment on a mass-to-charge (m/z) ratio scale. 100% intensity represents the highest peak. C, shown is a Western blot analysis of bc1 pulldown matrix proteins with anti-MDH antibody. Lane 1, purified bovine mitochondrial MDH; lane 2, mitochondrial matrix extract (MP); lane 3, bc1; lane 4, the precipitate from dialyzed mixture of the bc1 complex and mitochondrial matrix extract (bc1+MP); lane 5, standard proteins.

