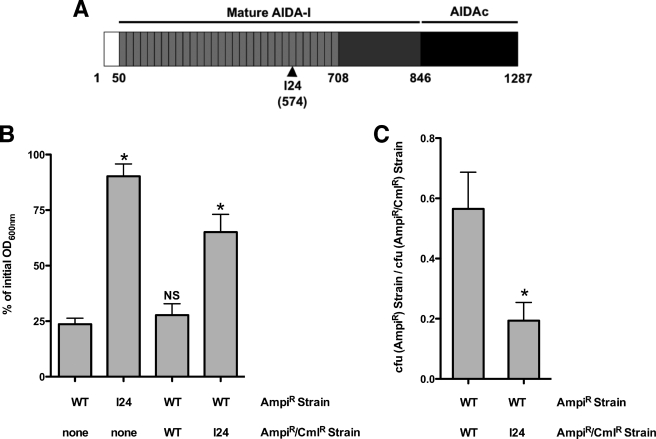
FIGURE 1.
Auto-aggregation of bacterial cells expressing AIDA-I. A, schematic representation of AIDA-I and the location of an auto-aggregation defective mutant, I24. The white box represents the signal sequence, the light gray boxes represent the imperfect 19-amino acids repeats, and the dark box represents the membrane-embedded fragment, AIDAc. B and C, auto-aggregation in mixes of bacteria expressing AIDA-I or I24. Overnight cultures of bacteria expressing wild-type AIDA-I (WT) or the I24 mutant were left standing in culture tubes for 180 min. The cultures have resistance against ampicillin (AmpiR) or against ampicillin and chloramphenicol (AmpiR/CmlR), respectively. In B, the OD600 nm values at the top of the cultures were compared with the values at the beginning of the assay. The columns were compared with the WT control by performing a one-way ANOVA and Dunnett's post tests. *, statistical significance (p < 0.05); NS, not significant. In C, the colony forming units (cfu) of bacteria bearing the different combinations of markers were evaluated, and a ratio was calculated. The ratios were compared by a Student's t test and were found to be statistically different. *, p < 0.05. The assays were performed three times in duplicate.

