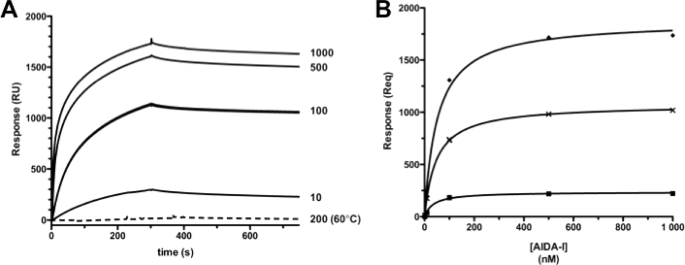
FIGURE 4.
In vitro evidence of AIDA-AIDA interactions. A, representative SPR for kinetic titrations of soluble AIDA-I (0–1000 nm) binding to 6,700 RU amine-coupled AIDA-I at 30 μl/min. The dashed line indicates 200 nm injection of heat-treated AIDA-I (60 °C for 20 min). B, representative SPR for equilibrium titrations of soluble AIDA-I (0–1000 nm) binding to immobilized AIDA-I at 10 μl/min. The symbols represent RU at equilibrium (Req), and the lines represent nonlinear regression analysis. The average of three independent trials yielded apparent KD constants of 36 nm (top curve, 6700 RU AIDA-I), 59 nm (middle curve, 2500 RU AIDA-I), and 52 nm (bottom curve, 1000 RU AIDA-I).

