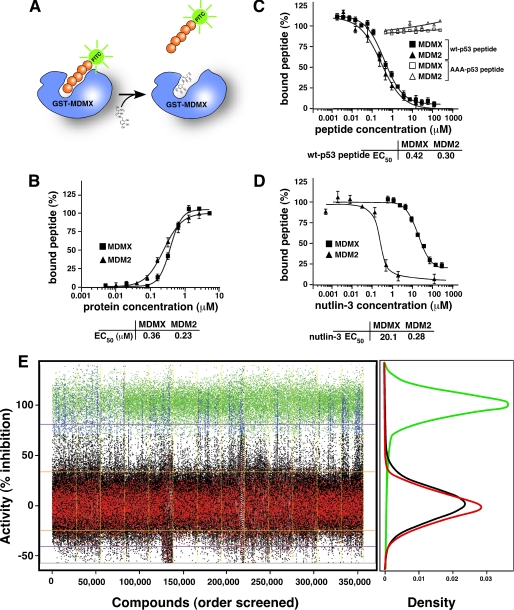
FIGURE 1.
Biochemical assays for high throughput screening to identify MDMX inhibitors. A, schematic of the FP assay used to identify MDMX inhibitors. The protein used for the screen consisted of residues 1–185 of MDMX fused to GST. The peptide (orange) was conjugated to FITC (green) for the primary screen and to Texas Red for secondary assays. B, plot of the percentage of bound p53-FITC peptide (at a fixed concentration) with increasing concentrations of MDMX (squares) or MDM2 (triangles). C, plot of the percentage of p53-FITC peptide associated with indicated proteins in the presence of increasing concentrations of unlabeled wild-type p53 peptide or unlabeled alanine-substituted p53 peptide (AAA-p53) as a negative control. D, plot of the percentage of p53-FITC peptide associated with the indicated proteins in the presence of increasing concentrations of nutlin-3a. B–D, each data point is the mean ± S.D. of triplicate experiments. E, scatterplot of HTS of a chemical library for MdmX inhibitors. The blue data points indicate compounds that were selected for further analysis, and the black data points are compounds that did not exhibit activity in the HTS. DMSO was used as a negative control (red), and the unlabeled p53 peptide (green) was used as a positive control. The density plot illustrates the clear separation of the positive and negative control samples across the entire screen. Each day of screening is separated by a yellow line.

