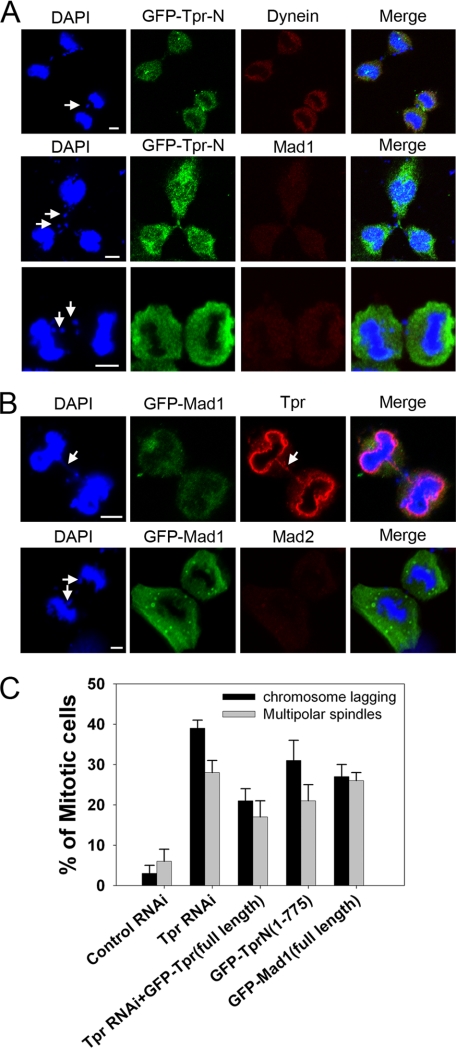
FIGURE 5.
Overexpression of GFP-Tpr N-terminal region (1–774) would mimic the Tpr siRNA (Mad1 reduction) phenotype. A, representative images of mitotic HeLa cells transfected with plasmids overexpressing GFP-Tpr-N(1–774aa). 48 h after transfection, cells were fixed, stained with anti-dynein antibodies or with anti-Mad1 antibodies (red in overlay; GFP is green), and analyzed by confocal laser microscopy. Chromatin was stained with DAPI (blue). Scale bars, 5 μm. Tpr-N binds to Mad1; therefore, functional Mad1 is sequestered from kinetochores, reducing the Mad1 signal. Again, typical chromosome lagging was found in Tpr-N-transfected cells. White arrows indicate chromosome lagging. B, representative images of mitotic HeLa cells transfected with plasmids overexpressing GFP-Mad1 (full-length). 48 h after transfection, cells were fixed, stained with anti-Tpr antibodies or with anti-Mad2 antibodies (red in overlay; GFP is green), and analyzed by confocal laser microscopy. Chromatin was stained with DAPI (blue). Scale bars, 5 μm. Mad1 binds to Tpr; therefore, functional Tpr is sequestered from kinetochores, mimicking Tpr depletion. As predicted, typical chromosome lagging was found in Tpr-N-transfected cells. White arrows indicate chromosome lagging. C, quantification (relative %) of chromosome lagging in the control siRNA, Tpr siRNA, overexpressed GFP-Tpr (full-length) 24 h following Tpr siRNA, GFP-Tpr-N alone, and GFP-Mad1 alone, transfected cells. Values are based on three independent experiments counting 100 mitotic cells in each experiment. Mean values ± S.D. (error bars) are shown. All cells were treated with double thymidine block, stained with DAPI, and visualized by confocal microscopy.

