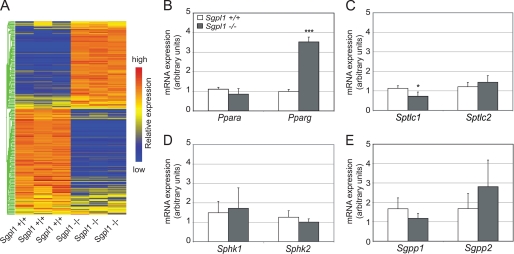
FIGURE 8.
Lipid metabolism gene expression profile in the liver of Sgpl1−/− mice exhibits widespread alteration. A, Affymetrix microarray gene expression analysis was performed with liver RNA from three Sgpl1+/+ and three Sgpl1−/− mice. The raw signal values of the genes from the GO category lipid metabolic process were clustered to produce a heat map as described under “Experimental Procedures.” Blue corresponds to reduced expression relative to red, which corresponds to relatively increased expression. RT-qPCR analysis of (B) Ppara and Pparg, (C) Sptlc1, and Sptlc2, (D) Sphk1 and Sphk2, and (E) Sgpp1 and Sgpp2 in liver mRNA from Sgpl1−/− (gray bars) and Sgpl1+/+ (open bars) mice. Data represent mean values ± S.E. n = 3. *, p < 0.05; ***, p < 0.005, paired Student's t test.

