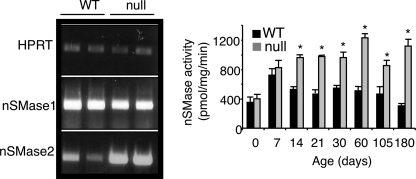
FIGURE 7.
N-SMase activity. The left panel shows reverse transcription-PCR of N-SMase 1 and 2 in WT versus CerS2 null mice at 1 month of age; hypoxanthine-guanine phosphoribosyltransferase 1 (HPRT) was used as a control for RNA isolation and cDNA synthesis. The right panel shows N-SMase activity. n = 3; *, p < 0.05.

