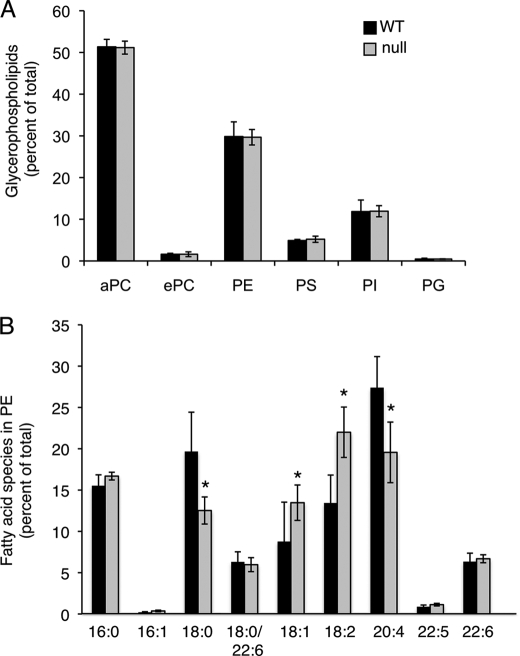
FIGURE 8.
Glycerophospholipid levels. Glycerophospholipid levels were analyzed by nano-ESI-MS/MS in 30-day-old WT and CerS2 null mouse livers. A, glycerophospholipid levels are shown as a percent of total glycerophospholipids. n = 4 ± S.D. B, distribution of fatty acid chains in phosphatidylethanolamine is shown. n = 2. aPC, phosphatidylcholine (acyl chains); ePC, phosphatidylcholine (ethyl chains); PE, phosphatidylethanolamine; PS, phosphatidylserine; PI, phosphatidylinositol; PG, phosphatidylglycerol. n = 3 ± S.D.; *, p < 0.05.

