FIGURE 2.
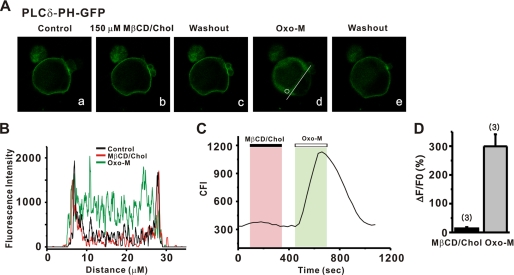
Cholesterol did not induce a PIP2 hydrolysis. A, translocation of membrane-localized PLCδ-PH to the cytosol reports PIP2 hydrolysis by cholesterol and muscarinic stimulation in HEK cells. B, plot of fluorescence intensity across a single line scan (A, white line) before and during the cholesterol (150 μm) or the Oxo-M (10 μm) response. C, continuous time plot of cytosolic fluorescence intensity recorded in a single region of interest (A, white circle). D, bars summarize the normalized cytosolic fluorescence increase by cholesterol and muscarinic stimulation. The change in fluorescence is given as ΔF/F0 × 100%, where ΔF = F − F0, F is peak fluorescence after drug application, and F0 is baseline fluorescence before agonist application.

