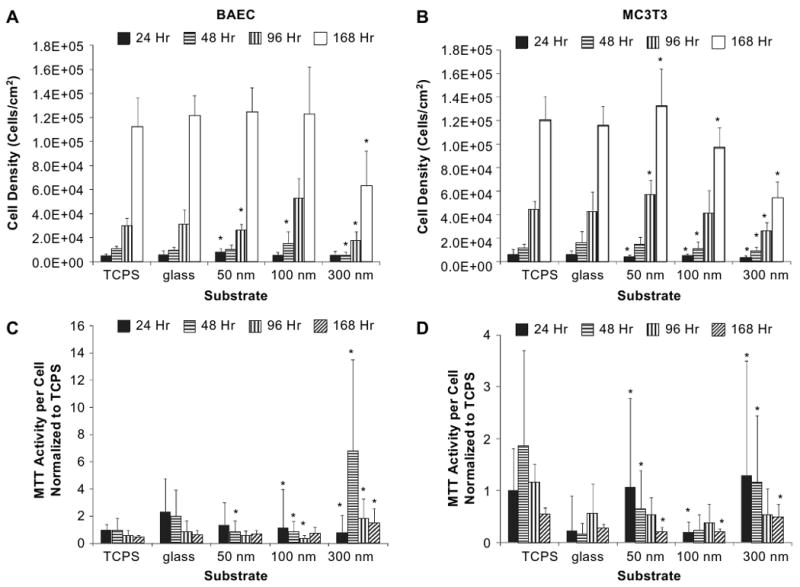
Fig. 6.

Mammalian cell proliferation and metabolic activity measurements. A and C represent BAEC data; B and D represent MC3T3 data. Metabolic activity (MTT) activity and cell number (density) were assessed over a period of 168 h (7 days). Initial seeding density was 3 × 10³ cells/cm2. Cell numbers were calculated for BAEC (A) and MC3T3 (B) is represented as values per unit area. MTT on a per cell basis and normalized to TCPS is shown in panel for (C) for BAEC and (D) for MC3T3. Asterisk represents data point that is statistically significant (p value of ≤0.1) in comparison to glass controls for that time point.
