
Figure 4.
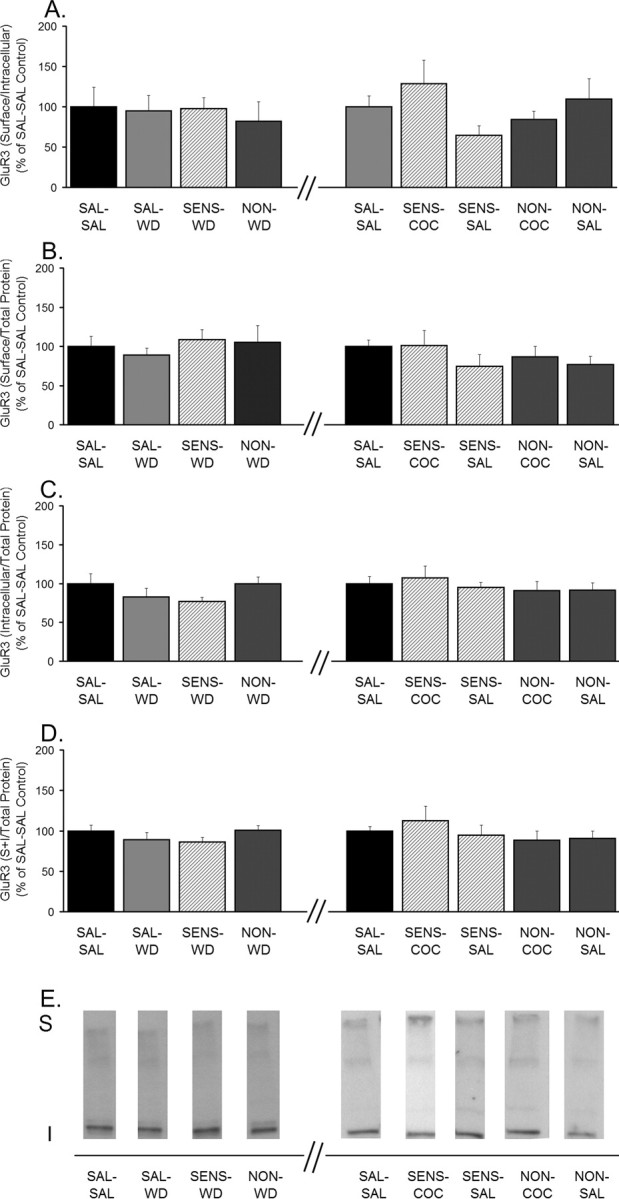
Distribution of GluR3 is unchanged after 14 d of withdrawal and after withdrawal plus challenge. A, GluR3 S/I ratio. B, GluR3 S levels normalized to total protein in the lane (S/total protein). C, GluR3 I levels normalized to total protein in the lane (I/total protein). D, GluR3 total protein levels normalized to total protein in the lane [(S + I)/total protein]. Data (mean ± SEM) are normalized to SAL-SAL controls and represent the sum of four independent experiments (2 withdrawal only and 2 withdrawal plus challenge). Data to the left of the x-axis break represent values from withdrawal-only groups. Data to the right of the x-axis break represent values from withdrawal-plus-challenge groups. SAL-SAL (n = 12–15; each group), SAL-WD (n = 14–16), SENS-WD (n = 14–16), NON-WD (n = 16–18), SENS-COC (n = 12), SENS-SAL (n = 7–9), NON-COC (n = 12–14), and NON-SAL (n = 11–13) are shown. ANOVA revealed no significant differences. E, Representative immunoblots.