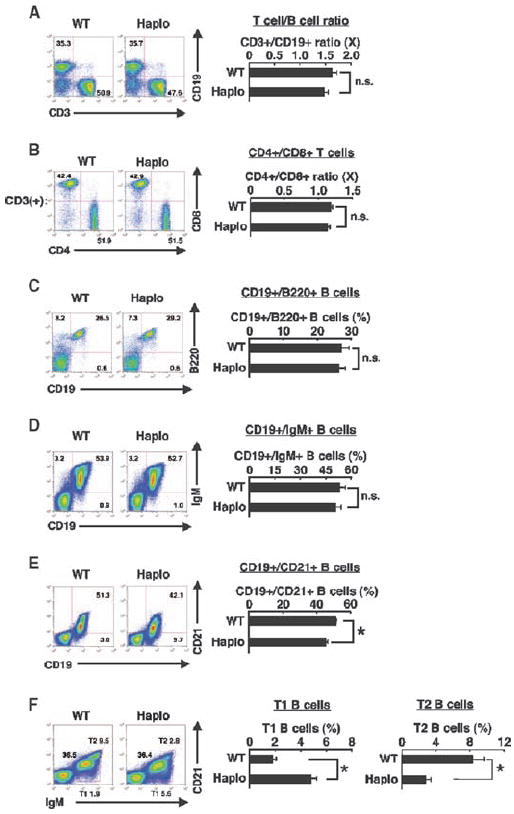
Fig. 3.

Flow cytometric analysis of subpopulations of splenocytes. Comparative analysis of splenocytes from WT and brx+/− (Haplo) mice based on their surface expression of (A) CD3 and CD19, (B) CD4 and CD8 (on CD3+ cells), (C) CD19 and B220, (D) CD19 and IgM, (E) CD19 and CD21, and (F) IgM and CD21. Representative flow cytometry experiments are shown in the left panels and pooled data from at least three independent experiments are shown in the right panels. Values shown are the means ± SEM of the ratios of the indicated cell populations when comparing WT to brx+/− mice. *P < 0.05; n.s., not significant (n = 3 to 5 mice).
