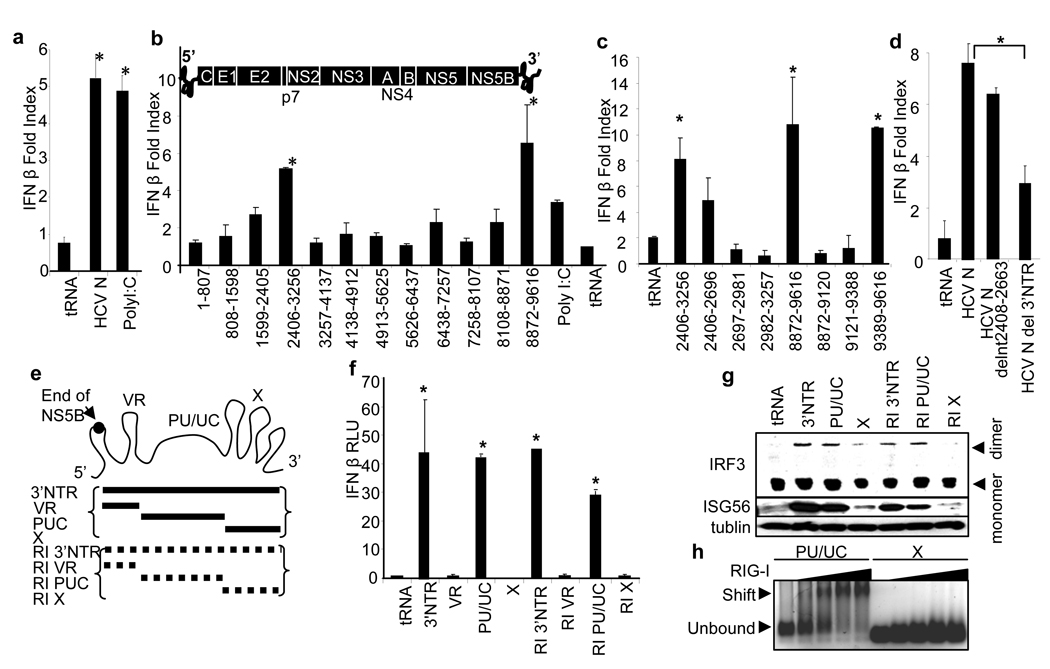
Figure 1. Identification of HCV PAMP RNA.
a–d, RNA-induced IFN-β promoter-luciferase activity in Huh7 cells, shown as mean fold-index induction (compared to non-treated cells; ±SD). Huh7 cells were transfected with 1 µg (0.4 pmol ) of HCV N (HCV 1b) genome RNA, 1 µg of poly inosine:cytosine (pIC) RNA (control) or with 1 µg ( 5–10 pmol) of of the indicated RNA species and harvested for dual luciferase assay 16 h later. HCV 1b refers to HCV genome RNA; tRNA, transfer RNA control; b–d, nt numbers encoded by HCV RNA constructs are shown. Bars are placed in their relative positions of each region within the HCV genome shown in b. The 5’ NTR, protein coding regions, and 3’ NTR are indicated. e, The HCV 3’ NTR motifs and respective RNA constructs. RI and broken lines denote replication intermediate. f, IFN-β promoter activation, shown here and in remaining figures as mean relative luciferase units (RLU; ±SD), triggered by 1 µg (20-150 pmole) of the indicated RNA species in transfected Huh7 cells. g, The abundance of IRF-3, ISG56 and tubulin (control) were measured by immunoblot. The upper panel shows the active IRF-3 dimer and inactive monomer forms separated by nondenaturing PAGE. h, RNA binding/gel-shift analysis of purified RIG-I with poly-U/UC or X region RNA (6 pmol) reacted with 0, 10, 20, 40, or 60 pmol of RIG-I protein. All RNAs contain 5’ppp. Asterisks indicate significant difference (P<0.01) as determined by Student’s T-test.

