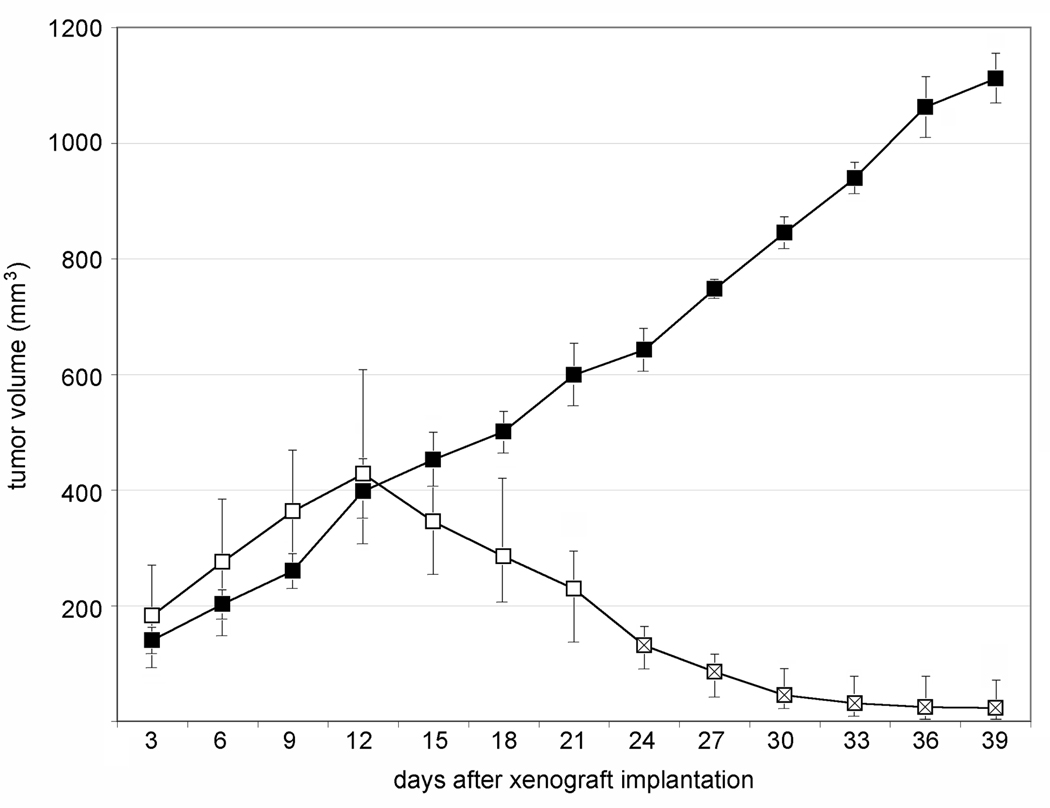
Figure 1.
HTB-15 xenograft growth after vehicle- or PVS-RIPO treatment. All tumor sizes were determined by caliper measurement. Open squares represent average sizes of 20 xenografts (bilateral tumors in 10 animals) and crossed open squares are the median sizes of 8 xenografts (bilateral tumors in 4 animals observed for 40 days post xenograft implantation). Closed squares are the median sizes of 4 bilateral xenografts in 2 vehicle-treated animals. The size range of all xenografts at any given interval is indicated. Virus/vehicle inoculation occurred on day 12, after measuring of the tumors.

