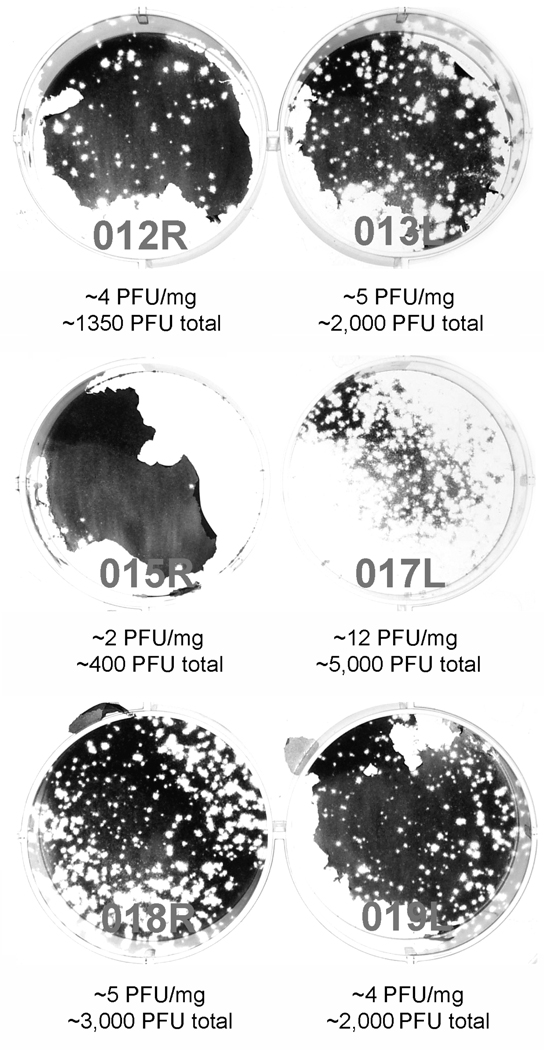
Figure 3.
Recovery of PVS-RIPO from HTB-15 xenografts 10 days post virus inoculation. Numbering refers to the animal and location of the xenograft the virus originated from. Estimates of PFU/mg xenograft tissue and total PFU/xenograft recovered are shown below for each tumor. The plaque assay of tumor 015R shows an artifact due to detachment of the cell layer during staining. The numbers shown were calculated from a repeat assay.

