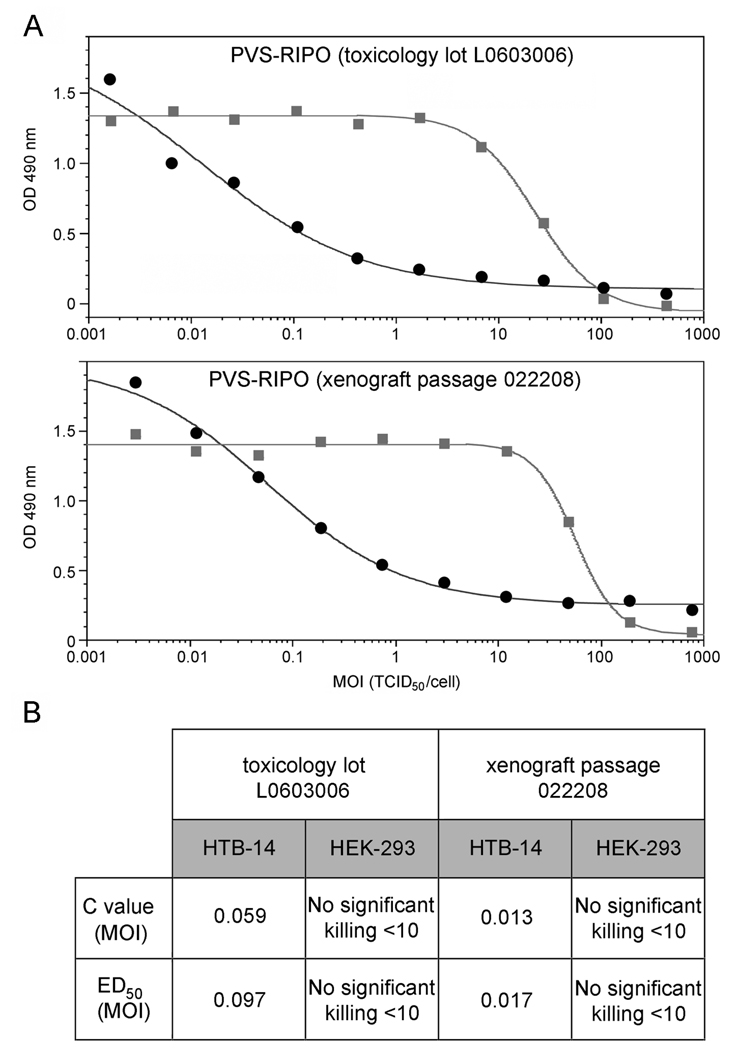
Figure 4.
Differential cell killing assay of PVS-RIPO. (a) Assays measuring differential cell killing of the control lot (L0603006; top panel) and xenograft passaged lot (022208; bottom panel) in HTB-14 cells (●) and HEK-293 cells ( ) yielded similar results. (b) C values refer to the virus titer at half maximal cell killing; ED50 values represent virus titers at 50% cell killing. C and ED50 values were unchanged upon PVS-RIPO xenograft passage.

