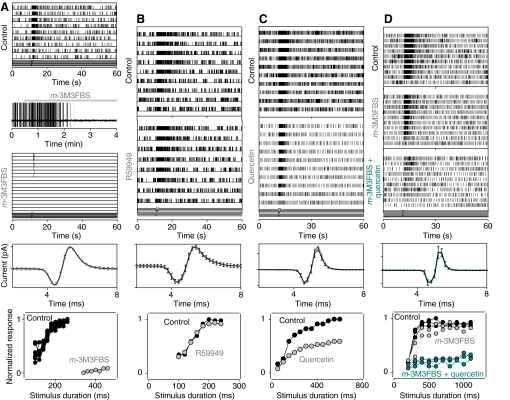
Fig. 4.
Effect of application of a PLC activator (A,D), a DAG kinase inhibitor (B) and a PI4K inhibitor (C,D) on the discharge of tonically active lobster ORNs in situ. Top panels: raster displays of action potentials from a single ORN in response to odorant pulses of decreasing intensity (from top to bottom), before (control) and in the presence of the drug. Time between successive sweeps, 60 s. (A) Application of m-3M3FBS (40 μmol l−1) completely blocked the spontaneous discharge and strongly reduced the evoked discharge. The gap-free recording between the raster displays shows the time course of the effect. (B) Treatment with the DAG kinase inhibitor R59949 (20 μmol l−1) failed to change either the spontaneous or the evoked activity of another cell. (C) Effect of quercetin (70 μmol l−1) application on spontaneous and odorant-evoked activity. (D) m-3M3FBS (20 μmol l−1) application slightly reduced the evoked discharge of another cell. The output of the cell was reduced further on blocking PI4K with quercetin (70 μmol l−1). The graphs below each set of raster plots show superposition of spikes in control conditions (black) and after incubation with the drugs (gray and cyan). Error bars show standard deviation of the mean (s.d.m.) (n=20–100). The minimal effect on spike shape suggests the drugs had little if any effect on voltage-dependent conductances. The bottom plots show the extent of blockade as a function of odorant intensity, with odorant intensity changed by increasing the duration of the stimulus. The normalized discharge frequency (ordinate) is plotted as a function of stimulus duration (abscissa). Black circles, control; gray and cyan circles, following incubation with the drug indicated on the graph. Data in A–D were obtained from different ORNs.

