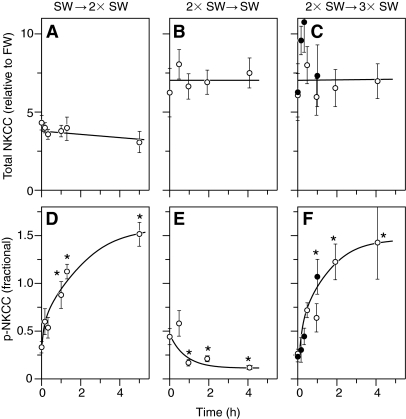
Fig. 8.
Short-term changes in total NKCC1 protein expression (A–C) and NKCC1 phosphorylation (D–F) after transition of fish from SW to 2× SW (A,D), 2× SW to SW (B,E), and 2× SW to 3× SW (C,F). Each point represents the mean ± s.e.m. of 6 individual fish in a cohort of fish studied in one experiment. Different symbols represent different experiments. One-way ANOVA determined a significant effect of time on p-NKCC in all three transfer experiments (P<0.001). Asterisks indicate a significant difference (P<0.05) from pre-treatment control within an experiment. There was no effect of time on total NKCC1 protein in any of the three experiments (P>0.191).

