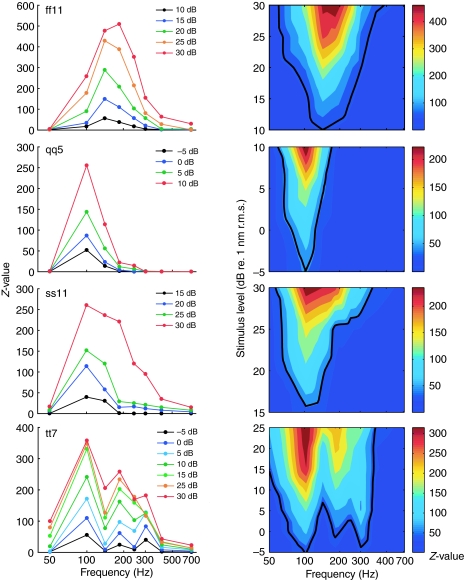
Fig. 3.
Frequency responses of four units. The left column represents isolevel frequency responses: Z-value is plotted as a function of frequency for different levels (see inset; x-axis: logarithmic scale; data points connected by straight lines for clarity). The right column shows contour plots: stimulus level is plotted as a function of frequency (x-axis: logarithmic scale). The black line in each contour plot outlines the tuning curve (criterion: Z=20). The color code to the right of each contour plot indicates Z-values. Frequency responses of afferents differed in terms of BF (or CF), in the sharpness of tuning and the shape of the function. ff11: BF/CF=141 Hz, Q10 dB=0.57, background rate=15 spikes s−1. qq5: BF/CF=100 Hz, Q10 dB=1.3, background rate=20 spikes s−1. ss1: BF/CF=100 Hz, Q10 dB=0.83, background rate=43 spikes s−1. tt7 had three peaks at 100, 185 and 303 Hz, Q10 dB was not defined, background rate=54 spikes s−1. Nineteen percent of units had a more complex response profile with two or three peaks (e.g. unit tt7).

