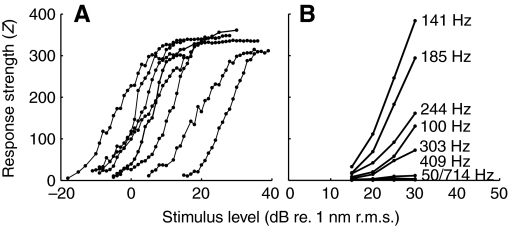
Fig. 9.
(A) Response (Z) versus level functions obtained at best frequency (BF) of seven units. Units had a wide variety of thresholds and functions were monotonically increasing up to a saturation point. (B) Response–level functions of unit ff3 (BF=141 Hz) plotted for various frequencies. Points are connected by straight lines in each graph for clarity. The steepest slope occurs at the BF, and steepness decreases with deviation from BF (at frequencies lower, as well as higher than BF).

