Abstract
Dynamic radiation force has been used in several types of applications, and is performed by modulating ultrasound with different methods. By modulating ultrasound, energy can be transmitted to tissue, in this case a dynamic force to elicit a low frequency cyclic displacement to inspect the material properties of the tissue. In this paper, different types of modulation are explored including amplitude modulation (AM), double sideband suppressed carrier amplitude modulation AM, linear frequency modulation, and frequency-shift keying. Generalized theory is presented for computing the radiation force through the short-term time average of the energy density for these various types of modulation. Examples of modulation with different types of signals including sine waves, square waves, and triangle waves are shown. Using different modulating signals, multifrequency radiation force with different numbers of frequency components can be created, and can be used to characterize tissue mimicking materials and soft tissue. Results for characterization of gelatin phantoms using a method of vibrating an embedded sphere are presented. Different degrees of accuracy were achieved using different modulation techniques and modulating signals. Modulating ultrasound is a very flexible technique to produce radiation force with multiple frequency components that can be used for various applications.
INTRODUCTION
Ultrasound radiation force is the phenomenon of acoustic waves transferring their momentum upon striking or interacting with an object thus creating a force and imparting motion to the object.1, 2 Investigation of ultrasound radiation force and its applications has been an area of research for almost 8 decades. Theoretical studies on radiation pressure were undertaken in Refs. 1, 2, 3, 4, 5, 6, 7. Within the last 15 years applications of radiation force in the medical imaging field have grown considerably making it an active area of research.
Ultrasound radiation force has been used to calibrate the output of transducers using the radiation force balance method.8, 9, 10 The manipulation of spheres, drops, bubbles, and other objects using radiation force has also been explored.11, 12, 13, 14, 15, 16 Methods based on radiation force have been developed to characterize different materials such as soft gelatin phantoms and soft tissue.17, 18, 19
One of the emerging uses of ultrasound radiation force is its use in ultrasound-based elasticity imaging. Focused ultrasound is used to exert a force on soft tissue and the mechanical response is measured with ultrasound-based or other methods.19, 20, 21, 22, 23, 24, 25
Radiation force can be classified as either static or dynamic.26, 27 Static radiation force is produced using continuous wave ultrasound to exert a constant force. Dynamic radiation force is created using ultrasound that has some sort of amplitude modulation through time.22, 27 The force changes with time based on the modulating function.
Dynamic ultrasound radiation force can be subdivided further into three categories: quasi-static, amplitude modulated, and frequency modulated. The quasi-static case results from using a finite duration toneburst of ultrasound, which exerts a transient force while the ultrasound is transmitted. This type of radiation force is used in acoustic radiation force impulse (ARFI) imaging where short tonebursts of ultrasound are used to impulsively excite tissue and the response is measured with ultrasound.19
Amplitude modulated ultrasound can be used to create a harmonic or multifrequency radiation force. This type of radiation force has been used in vibro-acoustography and shear wave elasticity imaging to displace tissue with a known harmonic function.20, 22, 28, 29 The use of amplitude modulation will be the main subject of this study and general cases will be described in more detail.
Lastly, frequency modulation (FM) of the ultrasound signal can be used to create a radiation force that changes frequency with time. Typically, the frequency shifts linearly through time and a “chirp” results. Chirped ultrasound has been used in radiation force applications in vibro-acoustography and in applications using contrast microbubbles to reduce standing wave artifacts.30, 31, 32
Modulation is used in communications to transmit information in one frequency band using a carrier signal that can be transmitted over large distances. In our case, we use ultrasound at megahertz frequencies as a carrier signal to transfer energy, or a vibration force, at low frequencies, by modulating the ultrasound to elicit the desired stimulation force. We gain the advantage of beamforming at ultrasound frequencies for localizing the radiation force energy to create vibration motion at low frequencies such that the displacements are large enough to be measured with ultrasound or other techniques.
In this paper, we will present general theory that describes the formation of ultrasound radiation force using full amplitude modulation (AM) as well as double sideband suppressed carrier amplitude modulation (DSB-SC AM). The generation of radiation force with different modulating functions will be explored. Validation of the time- and frequency-domain relationships will be demonstrated with experimental data. Also, an example of material characterization using different modulation techniques and functions will be shown.
METHODS
The acoustic radiation force on an object can be defined as follows:
| (1) |
where F(t) is the radiation force, dr is the drag coefficient, S is the surface over which the ultrasound energy acts, and ⟨E(t)⟩T is the short-term time average of the energy density. The short-term time average is computed such that T, the averaging period, is longer than the period of the ultrasound wave but much shorter than the modulation period, 2π∕ωc⪡T⪡2π∕ωm where ωc and ωm are the carrier (ultrasound) frequency and the modulation frequency, respectively.22 If we have an absorbing medium we can write F(t)=2α⟨I(t)⟩T∕c=α⟨E(t)⟩T, where α is the ultrasound attenuation coefficient and I(t) is the ultrasound intensity.19 Assuming plane wave propagation, the energy density is defined as
| (2) |
Three types of modulation will be explored in this paper: amplitude modulation, double sideband suppressed carrier amplitude modulation, and frequency modulation. In this paper, we will ignore the spatial dependence of the focused ultrasound fields as that adds another dimension of complexity that is beyond the scope of this work.
AM
We start with amplitude modulation by defining A(t) as the modulation function as follows, including a dc offset:33
| (3) |
where Ac is the amplitude, μ is the modulation index that can vary from 0≤μ≤1, and xm(t), where |xm(t)|≤1, is the baseband or modulation function. The pressure for an AM ultrasound beam is given as
| (4) |
where ωc is the carrier frequency, or in this case the ultrasound frequency. Equation 4 can be expanded as
| (5) |
To find the radiation force we need to square the pressure and take the short-term time average. We start by squaring the relationship in Eq. 5 and expand using the trigonometric identity cos2(ωt)=(1+cos(2ωt))∕2.
| (6) |
| (7) |
After collecting terms, we arrive at the following expression for the square of the pressure function:
| (8) |
Applying the short-term time average eliminates the terms at 2ωc and the energy density is then computed in Eq. 10.
| (9) |
| (10) |
For the case in which xm(t)=cos(ωmt), we can substitute and rewrite Eq. 10 as
| (11) |
Applying the same trigonometric identity as above and simplifying give
| (12) |
| (13) |
The result in Eq. 13 is interesting because the energy density has a dc term, a term at ωm and at 2ωm. In most cases μ=1, which represents 100% modulation, but if μ approaches 0, then the first term at 2ωm decreases.
DSB-SC AM
Now we will consider the case where the modulating function is defined without a dc offset33
| (14) |
We again consider the pressure signal
| (15) |
Squaring the pressure gives
| (16) |
and expanding and collecting terms give
| (17) |
The short-term time average once again eliminates the term at 2ωc and the energy density is given in Eq. 19.
| (18) |
| (19) |
For the case in which xm(t)=cos(ωmt), we can substitute and rewrite Eq. 19 as
| (20) |
and then expanding we obtain
| (21) |
This type of modulation provides a dc term and a component at 2ωm, and in most cases μ=1, which causes μ2=1.
As another more complex case, we can define μ=1 and xm(t) as a square wave signal as has been previously explored,34 but will be summarized here for emphasis.
| (22) |
Using Bracewell’s notation and conventions, the radiation force can be written as a temporal convolution of an impulse train III(t), with a time-shifted rectangular function II(t).35 The time-shifted rectangular function has width Tb, amplitude a, and the time shift is Tb∕2. A repetition period of Tr, or a rate fr=1∕Tr, is used for the impulse train and 1∕Tr is used to maintain unit height. The duty cycle can be written as D=Tb∕Tr=Tbfr.
Squaring xm(t) yields the same function assuming unit amplitude. We can examine the frequency components by evaluating the Fourier transform, where Xm(f) is the Fourier transform of xm(t).
| (23) |
We can substitute the repetition frequency fr for the 1∕Tr terms as follows:
| (24) |
We can further simplify by writing in terms of the duty factor.
| (25) |
The square wave radiation force has components at harmonics of the toneburst repetition frequency fr, and the amplitude of those components will be governed by a sinc function that has the duty factor in its argument. The frequency-domain representation will be a set of impulses located at integral multiples of fr and modulated by afrTbe−iπTbnfr sinc(Tbnfr).
FM
If we consider frequency modulation we can write the modulating function as33
| (26) |
In this paper, we will consider ϕ(t) to be a quadratic function with respect to time defined as ϕ(t)=((ω2−ω1)∕(t2−t1))t2=(Δω∕Δt)t2. The instantaneous frequency, which is the derivative of ϕ(t), is then a linear function dϕ(t)∕dt=2(Δω∕Δt)t. The pressure is defined as
| (27) |
We then square the pressure and take the short-term time average and then arrive at the energy density.
| (28) |
| (29) |
| (30) |
If DSB-SC AM is used, A(t)=Ac cos(ϕ(t)), and ⟨E(t)⟩t is defined as
| (31) |
Frequency-shift keying (FSK)
As an example of encoding the radiation force we present an example using FSK. The principle of this modulation technique is that the frequency of the carrier or the modulating signal is adjusted to binary bits, 0 and 1.33 In this study, we change the frequency of the modulating signal. To accomplish this, traditional AM or DSB-SC AM could be used and the modulating signal would change based whether the bit in a code s[n] was 0 or 1. The energy density could be defined as in the following equation using AM where xm,0(t) is used to encode s[n] as 0 and xm,1(t) is used to encode s[n] as 1.
| (32) |
EXPERIMENTS
We will present experiments designed to validate the theory that has been presented above and give an example of an application using multifrequency radiation force similar to that presented in Ref. 28. We modulated an ultrasound signal with different functions and derived the radiation force with the pressure from the needle hydrophone measurements. Because the force is a quadratic function of the pressure, we could not directly validate the force. We approached this validation in an indirect fashion.
To validate the theory presented in this study and exhibit an application of this general technique we measured the motion of a steel sphere in a gelatin phantom as we changed the modulating signal used. This is a variation of the method introduced by Chen et al.17 to measure the viscoelastic material properties of the gelatin by finding the frequency response of the sphere induced by radiation force. First, we will use the method described by Chen et al.17 to characterize the viscoelastic material properties of the gelatin. We will then use the theory presented below to compute the sphere displacement from the force derived from the needle hydrophone measurements, and the theory that was presented above. We will compare that displacement signal with the displacement we measure.
There is also another more indirect way of validating the theory that was presented above. If we use the same phantom and change the modulating signal, we will induce different motion. Using the derived force from needle hydrophone measurements and the motion measurements, we can find the material properties of the gelatin. If the developed theory is correct, then we should obtain the same values for the material properties regardless of the modulation technique.
These measurements with modulated ultrasound signals will provide an application of this general method for the characterization of the viscoelastic material properties in one measurement as opposed to the original method put forth by Chen et al.,17 where multiple single frequency measurements are performed.
Needle hydrophone measurements
Needle hydrophone measurements were performed to measure the ultrasound radiofrequency (rf) signal in a water tank. This signal was used to derive the radiation force time- and frequency-domain representations to compare with results from the analytic expressions detailed above. These measurements will be used as a forcing function input for later measurements made in a gelatin sphere phantom to evaluate the transfer function of the phantom material. A 0.5 mm diameter needle hydrophone (NTR Systems, Seattle, WA) was positioned in a large water tank at the focus of a 3.0 MHz transducer with a diameter of 45 mm and a spherical focus of 70 mm, which was assembled in-house using a focused piezoelectric crystal (Boston Piezo-Optics, Inc., Bellingham, MA).
Different waveforms and types of modulation were used for validation of the theory presented above. A sine wave of frequency 100 Hz was used for xm(t) for AM, and a sine wave of frequency 50 Hz was used for xm(t) for DSB-SC AM. A square wave with a 50% duty cycle, Tb=5 ms and Tr=10 ms, was used with amplitude modulation. A triangle wave was used with AM. An AM implementation with a linear FM signal was used with a bandwidth of 1 μHz–5000 Hz, and the frequency sweep was performed in 50 ms. Lastly, a FSK signal was formed by defining a digital zero as 8 cycles of a square wave with 50% duty cycle with Tr of 5 ms (fr=200 Hz) and a digital one as 4 cycles of a square wave with 50% duty cycle with Tr=10 ms (fr=100 Hz).
Steel sphere phantom study
From the ultrasound rf signals, the radiation force can be calculated, within a constant multiplier, by squaring the pressure and applying a low-pass filter for each modulation waveform. We used the same waveforms as were characterized in the needle hydrophone measurements for vibrating a 440C stainless steel sphere with diameter of 1.59 mm embedded in three types of gelatin phantoms. Phantoms 1, 2, and 3 were made from 300 Bloom gelatin powder (Sigma-Aldrich, St. Louis, MO) with concentrations of 10%, 10%, and 12% by volume, respectively, and glycerol (Sigma-Aldrich, St. Louis, MO) with concentrations of 0%, 10%, and 10% by volume, respectively. A preservative of potassium sorbate (Sigma-Aldrich, St. Louis, MO) was also added with a concentration of 10 g∕L to all three phantoms. Unless otherwise noted, the results shown are from phantom 1. A Doppler laser vibrometer (Polytec, Waldbronn, Germany) was used to measure the velocity of the sphere. We measure the velocity because it is proportional to the force imparted on the sphere.
The velocity can be used to characterize the system if the force is known. We can apply linear systems modeling where v(t) is the velocity, f(t) is the force, and z(t) is the mechanical impedance function for the sphere∕gelatin phantom. The force is equal to the convolution of the velocity and the impedance function.
| (33) |
In the frequency domain the force denoted as F(ω) is the product of the frequency-domain representations of the velocity V(ω) and the impedance Z(ω).17, 36
| (34) |
We can estimate the impedance function by dividing the force function derived from the transmitted ultrasound measured before amplification by the measured velocity
| (35) |
Using a model defined by Ostreicher and utilized by Chen et al., we can find the shear elasticity μ1 and shear viscosity μ2, assuming a value of 1000 kg∕m3 for the density of the gelatin.17, 37 We consider this method to be our gold standard, or reference, measurement for μ1 and μ2.
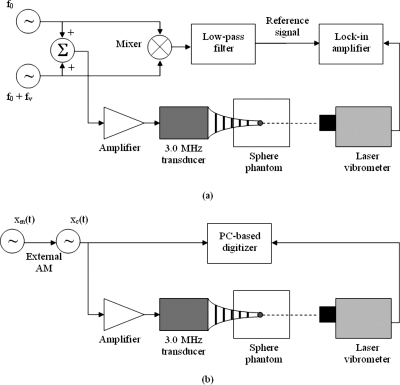
To obtain a reference measurement for characterization of the gelatin, a DSB-SC AM signal with xm(t)=cos(2πfmt) where fm was varied from 25 to 1000 Hz to yield vibration frequencies of 50–2000 Hz. The output of the laser vibrometer was processed by a lock-in amplifier (Signal Recovery, Oak Ridge, TN) to obtain the measurements of the magnitude of the velocity. The advantage of using the modulated ultrasound waveforms is that they produce multiple frequencies so that the impedance function can be estimated in one measurement compared to making a set of discrete measurements at single frequencies with the lock-in filter. However, when using modulation, each frequency component has a different magnitude and so we must take that into account when trying to characterize the mechanical system as indicated in Eq. 35. We normalize for the magnitude variation of the force when we use the DSB-SC AM method, varying the frequency to one value at a time, because we ensure that the same force magnitude is used for each measurement. A figure of the experimental setup with the lock-in filter is shown in Fig. 1a and with the digitizer in Fig. 1b.
Figure 1.
Experimental setups. (a) Experimental setup with DSB-SC AM modulation, sphere velocity was measured with the laser vibrometer and lock-in filter. (b) Experimental setup with modulated ultrasound, sphere velocity was measured with the laser vibrometer and recorded with PC-based digitizer.
For the experiment with the lock-in filter we use two signal generators (33250A, Agilent, Santa Clara, CA) to generate signals at f0 and f0+fv where f0 is 3.0 MHz and fv is the desired vibration frequency, and the carrier frequency is fc=(f0+fv)∕2. Those signals are added using a hybrid junction (M∕A COM, Inc., Lowell, MA) and used as input to the amplifier. The amplified output was applied to the 3.0 MHz transducer. The ultrasound signals were also used as inputs for a mixer. The output of the mixer was low-pass filtered to get a reference signal at fv for the lock-in amplifier (Signal Recovery, Oak Ridge, TN). The laser vibrometer output was also input to the lock-in amplifier.
For the experiment with the PC-based digitizer (Alazartech, Montreal, QC, Canada), the modulating signal xm(t) was created using one signal generator (33250A, Agilent, Santa Clara, CA) and that signal was applied to the external AM input of another signal generator set at 100% modulation index that was generating the 3.0 MHz ultrasound carrier frequency xc(t). The modulated signal was sent to one channel of the digitizer and also amplified and applied to the transducer. The laser vibrometer signal was sent directly to the digitizer. The sampling frequency for both signals was 50 MHz.
We fit the velocity data from the laser vibrometer to the model first presented by Ostreicher and subsequently used by Chen et al., to characterize tissue mimicking gelatin17, 37 to find the viscoelastic parameters μ1 and μ2.
| (36) |
The impedance terms, derived under plane wave conditions, are given as
| (37) |
| (38) |
where , , μ=μ1+iωμ2, λ=λ1+iωλ2, a is the radius of the sphere, ρ is the mass density of the medium, μ1 and μ2 are the shear elasticity and viscosity of the medium, λ1 and λ2 are the bulk elasticity and viscosity, and ρs is the mass density of the sphere. The values used for this model implementation were ρ=1000 kg∕m3, a=0.794 mm, ρs=7849 kg∕m3, λ1=2.48 GPa, and λ2=0. The curve fits to the model were performed using the nlinfit.m function in MATLAB (The Mathworks, Natick, MA).
To validate the theory on modulating ultrasound with the measurements, we examine the displacement of the sphere from theoretical and experimental bases. For the sphere in the gelatin phantom we can derive the displacement by integrating Eq. 36. In the frequency domain, this is accomplished by dividing both sides of the equation by iω, yielding
| (39) |
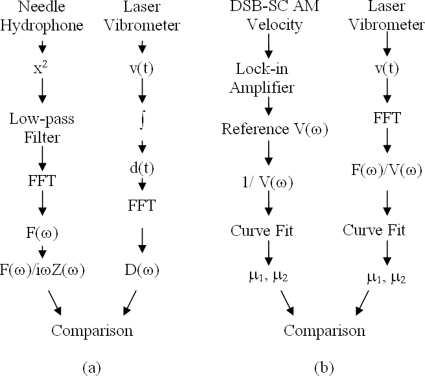
We can take the force that we derive from the pressure measurements using the needle hydrophone and divide by the product iωZ(ω) that is computed from the results of the reference measurement using single modulation frequencies and the lock-in amplifier. We then will compare this with the measured displacement. If the theory is correct, the results should match. A flow diagram of this process is shown in Fig. 2a.
Figure 2.
Validation methods for the multifrequency radiation force theory. (a) The force is derived from the pressure measured by the needle hydrophone. The pressure is squared and low-pass filtered and the spectrum is computed. The force spectrum is divided by iωZ(ω). The velocity measured by the laser vibrometer was integrated to get displacement. The displacement spectrum was computed and compared to the signal derived from the needle hydrophone. (b) The DSB-SC AM measurements made with the lock-in amplifier provide a reference measurement of impedance Z(ω), and a curve fitting was performed to get μ1 and μ2. The laser vibrometer velocity signal is measured and the reference force signal is divided by V(ω). The curve fit is performed and μ1 and μ2 values are compared.
We also used a large set of modulating waveforms to estimate the impedance function for the gelatin phantom including AM with square waves of duty cycles ranging from 25% to 80%, a triangle wave, a sawtooth wave, a linear FM signal, and FSK performed with the square waves of duty cycles ranging from 25% to 75%, a triangle wave, and a sawtooth wave. Using DSB-SC AM we used a triangle wave, a linear FM signal, and a FSK with a triangle wave. These modulating signals yielded a multifrequency radiation force and we evaluated how these types of signals could be used to measure the mechanical properties of the gelatin phantom in one measurement. The reference measurements and the measurements with different modulating waveforms were performed on all three phantoms that were made for this study. A flow diagram for this process with the modulation functions is shown in Fig. 2b.
RESULTS
Needle hydrophone measurements
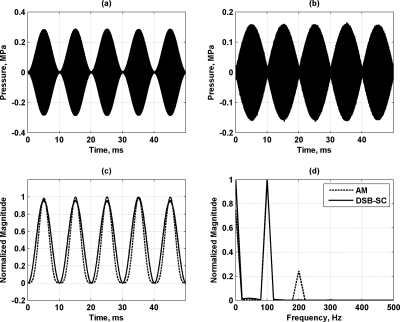
Figure 3a shows the ultrasound pressure for AM performed with a sine wave with frequency of 100 Hz, and Fig. 3b shows the ultrasound pressure for DSB-SC AM performed with a sine wave with frequency of 50 Hz. The waveforms appear filled because of the many ultrasound cycles within the 50 ms timeframe of the transmission. Figure 3c shows the calculated radiation force produced by the two types of modulated ultrasound in Figs. 3a, 3b. Figure 3d shows the frequency-domain representations of the signals in Fig. 3c. The frequency components are in agreement in proportion and frequency as the analytic expressions in Eqs. 13, 21 for the AM and DSB-SC AM cases, respectively.
Figure 3.
Modulation with sinusoidal functions. (a) Ultrasound pressure for AM with sinusoidal function with frequency 100 Hz. (b) Ultrasound pressure for DSB-SC AM with sinusoidal function with frequency 50 Hz. (c) Calculated radiation force for modulation in (a) and (b). (d) Spectra for radiation force in (c). The legend in (d) applies to (c) and (d).
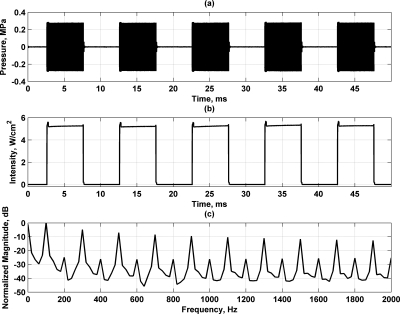
Figure 4a shows the ultrasound pressure for AM with a square wave with 50% duty cycle. Figures 4b, 4c show the time- and frequency-domain representations of the intensity, which is proportional to the radiation force. The square wave has components at odd harmonics of the fundamental, 100 Hz. The components at the even harmonics are low compared to adjacent odd harmonics and are probably introduced because of the ultrasound overshoot at the beginning of a toneburst, and the extra transmission or standing wave at the end of the toneburst observed in the needle hydrophone measurements.
Figure 4.
Modulation with AM square wave with 50% duty cycle and frequency of 100 Hz. (a) Modulated ultrasound, (b) Intensity for modulated ultrasound in (a), and (c) spectrum for intensity in (b).
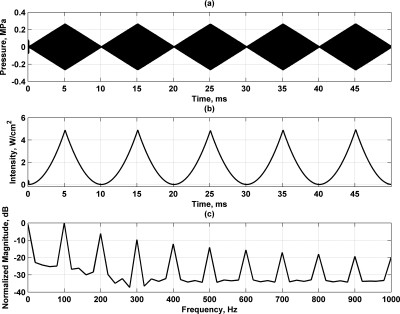
Figure 5a shows a triangle wave used for modulation. Figures 5b shows the intensity when the triangle wave is used in AM, respectively. The frequency-domain representations of the intensity are shown in Fig. 5c. The triangle wave modulation signal provides components at harmonics of the fundamental frequency, 100 Hz. The use of different modulating functions changes the amplitude of the components that they produce in the radiation force.
Figure 5.
Modulation with AM triangle wave with frequency of 100 Hz. (a) Modulated ultrasound, (b) intensity for modulated ultrasound in (a), and (c) spectrum for intensity in (b).
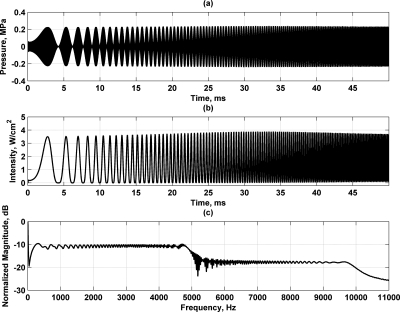
Figure 6a shows a linear FM signal, and Fig. 6b shows the intensity. The frequency-domain representations of the FM function and the intensity are shown in Fig. 6c. The use of frequency modulation provides a near constant bilevel radiation force from 0 to 5 kHz and from 5 to 10 kHz, which is separated by about 6 dB. However, the force is not constant at the extremes of the bandwidth used, particularly at the lower frequencies from 0 to 300 Hz and at the transition around 5 kHz.
Figure 6.
Modulation with AM with linear FM signal that sweeps from 1 μHz to 5000 Hz in 50 ms. (a) Modulated ultrasound, (b) intensity for modulated ultrasound in (a), and (c) spectrum for intensity in (b).
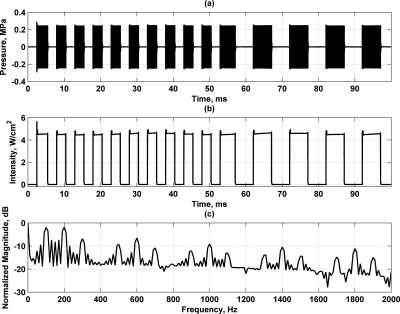
For the case of the FSK with a square wave with two different fundamental frequencies, Fig. 7a shows the modulated ultrasound pressure signal. The intensity is shown in Fig. 7b, and the frequency-domain representation of the intensity is shown in Fig. 7c. The FSK square wave yields components at the odd harmonics of the fundamental frequencies of the modulating signals used to encode the different bits, 200 and 100 Hz, respectively. From the first segment (0–50 ms), components at 200, 600, 1000, 1400, and 1800 Hz result, and from the second segment (50–100 ms), components at 100, 300, 500, 700, 900, 1100, 1300, 1500, 1700, and 1900 result. In total, using this 2 bit code yields 15 unique components.
Figure 7.
Modulation with AM using FSK with square wave frequencies of 200 Hz for 0–50 ms and 100 Hz for 50–100 ms. (a) Modulated ultrasound, (b) intensity for modulated ultrasound in (a), and (c) spectrum for entire intensity in (b).
Sphere phantom characterization
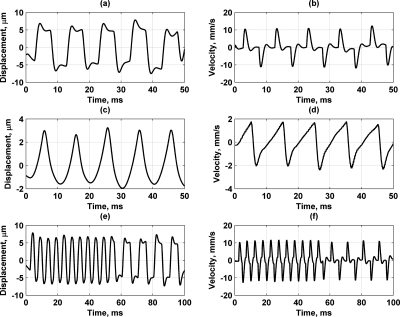
We measured the velocity of a sphere induced by the multifrequency radiation force for different modulating functions directly with the laser vibrometer and derived the displacement by integrating the velocity signal. Figures 8a, 8b show the sphere displacement and velocity for the AM square wave excitation. Figures 8c, 8d show the sphere displacement and velocity for the AM triangle waveform. Figures 8e, 8f show the sphere displacement and velocity for the FSK square wave signal. The displacements look very similar to the force depicted in Figs. 4b, 5b, 7b for the square, triangle, and FSK modulation functions. There is some very low frequency drift that is most prevalent in the AM triangle wave results. These qualitative similarities are an indication that the theory used to derive the force is correct.
Figure 8.
Displacement and velocity of sphere embedded in gelatin phantom obtained using different modulation signals to produce radiation force. (a) Sphere displacement for AM square wave used in Fig. 4. (b) Sphere velocity for AM square wave. (c) Sphere displacement for AM triangle wave used in Fig. 5. (d) Sphere velocity for AM triangle wave. (e) Sphere displacement for FSK square wave used in Fig. 7. (f) Sphere velocity for FSK square wave.
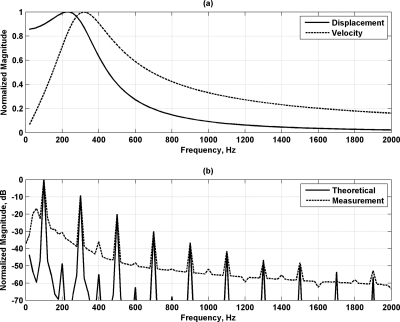
The reference measurement with single frequencies was carried out and yielded μ1=5.23 kPa and μ2=0.72 Pa s for phantom 1. These values were used for computing the displacement using Eq. 39 and the velocity using Eq. 36 assuming a constant force for all frequencies. The normalized magnitude spectra for the displacement and velocity are shown in Fig. 9a. If we look at these spectra from a linear systems perspective, the displacement has a low-pass filter characteristic and the velocity has a bandpass filter characteristic. The low-pass filter nature of the displacement response agrees with the qualitative assessment of the measured displacement previously mentioned and displayed in Fig. 8. We then took the derived force for square wave modulation from Fig. 4b and divided it by the computed product iωZ(ω) and compared that with the measurement from square wave modulation shown in Fig. 8a. The normalized theoretical and measured results are shown in Fig. 9b. The agreement is very good. This result serves as verification of the modulation theory.
Figure 9.
Validation results using measured and calculated displacements. (a) Calculated displacement and velocity responses assuming a constant force at all frequencies. (b) Theoretical and measured displacement magnitude spectra results. The theoretical magnitude spectrum was calculated using the force derived from pressure measurements made with a needle hydrophone [Fig. 4b] divided by the calculated product iωZ(ω). The measured magnitude spectrum is from the displacement in Fig. 8a.
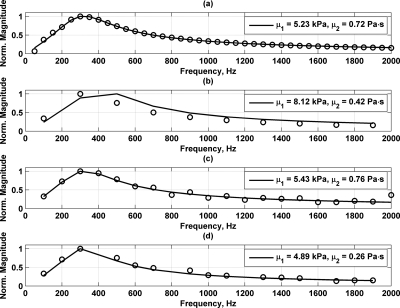
Figure 10a shows the reference measurement made with the DSB-SC AM measurements and the estimated impedance function. Figure 10b shows the magnitude spectrum of the sphere phantom impedance function derived from the transmitted ultrasound and the velocity measured by the laser for the AM square waveform. Figures 10c, 10d show the magnitude spectra for the impedance function obtained using the AM triangle modulating signal and the FSK square wave signal, respectively. The number of frequency components with high signal-to-noise ratio (SNR) varies based on the modulating signal. The solid lines in the plots in Fig. 10 are the curve fits to the model for the embedded sphere in a viscoelastic medium. We performed this for the different waveforms used in this study and tabulated the results in Table 1.
Figure 10.
Sphere phantom impedance functions and model fits for different modulation functions. (a) Data, denoted by the open circles, and model fit, denoted as the solid line, for DSB-SC AM with sinusoidal modulating function. The legends contain the material properties from the model fit in each respective panel, (b) Data and model fit for AM with square wave with 50% duty cycle as modulating function. (c) Data and model fit for AM with triangle wave as modulating function. (d) Data and model fit for AM with FSK square wave with 50% duty cycle as modulating function.
Table 1.
Model fitting results for viscoelastic properties of gelatin with different modulation signals.
| Modulation signal | μ1 (kPa) | μ1 (kPa) (interpolation) | μ2 (Pa S) | μ2 (Pa S) (interpolation) |
|---|---|---|---|---|
| DSB-SC sine (reference) | 5.23 | 5.23 | 0.72 | 0.72 |
| AM square 25% | 5.15 | 5.32 | 0.62 | 0.88 |
| AM square 30% | 4.94 | 5.19 | 0.51 | 0.76 |
| AM square 50% | 4.57 | 5.60 | 0.19 | 0.77 |
| AM square 75% | 5.77 | 5.37 | 0.37 | 0.83 |
| AM square 80% | 5.89 | 6.00 | 0.53 | 0.57 |
| AM triangle | 5.27 | 5.55 | 0.67 | 0.59 |
| AM sawtooth | 5.22 | 5.30 | 0.58 | 0.63 |
| AM chirp 5 kHz | 7.24 | 6.85 | −0.08 | 0.40 |
| AM FSK square 25% | 5.17 | 5.29 | 0.54 | 0.63 |
| AM FSK square 50% | 5.45 | 5.18 | 0.45 | 0.80 |
| AM FSK square 75% | 5.04 | 5.18 | 0.82 | 0.85 |
| AM FSK triangle | 5.47 | 5.56 | 0.86 | 0.90 |
| AM FSK sawtooth | 5.36 | 5.62 | 0.69 | 0.66 |
| DSB-SC triangle | 5.46 | 5.57 | 0.80 | 0.85 |
| DSB-SC chirp 5 kHz | 9.35 | 9.28 | 0.57 | 0.32 |
| DSB-SC FSK triangle | 5.33 | 5.44 | 0.79 | 0.87 |
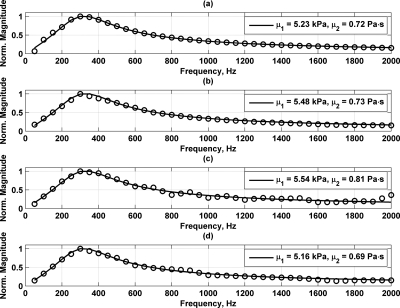
Noting that each modulating signal produces different components with significant SNR in the radiation force, we attempted to account for this fact by performing linear interpolation and extrapolation over the frequency bandwidth that was used for the reference measurement, 50–2000 Hz. We performed the linear interpolation and fit the results to the model as was explained above, and those results are also summarized in Table 1. Using the same modulation signals as shown Fig. 10, linear interpolation was performed and the model fits are shown in Fig. 11.
Figure 11.
Sphere phantom impedance functions and model fits for different modulation functions. (a) Data, denoted by the open circles, and model fit, denoted as the solid line, for DSB-SC AM with sinusoidal modulating function. The legends contain the material properties from the model fit in each respective panel. (b) Interpolated data and model fit for AM with square wave with 50% duty cycle as modulating function. (c) Interpolated data and model fit for AM with triangle wave as modulating function. (d) Interpolated data and model fit for AM with FSK square wave with 50% duty cycle as modulating function.
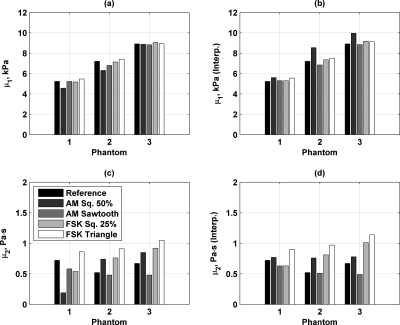
The reference measurement with single frequencies was carried out on phantoms 2 and 3 and yielded μ1=7.21 kPa and μ2=0.52 Pa s, and μ1=8.92 kPa and μ2=0.67 Pa s, respectively. The phantoms had increased shear elasticity, but did not have increased shear viscosity. We compared the material property estimates made from measurements using different modulation waveforms such as AM with square wave with 50% duty cycle, AM with a sawtooth wave, AM FSK with square wave with 25% duty cycle, and AM FSK with a triangle wave. Figure 12 summarizes those estimation results for all three phantoms for μ1 and μ2 without and with interpolation. In general, the estimates for μ1 were similar to the reference measurement, but the estimates for μ2 were more varied.
Figure 12.
Comparison of material property estimation for three gelatin phantoms for different modulation waveforms. The reference measurement is the DSB-SC AM measurements made with single frequencies. (a) Estimation of μ1, (b) estimation of μ1 with interpolation, (c) estimation of μ2, and (d) estimation of μ2 with interpolation.
DISCUSSION
Using different types of modulation and modulating signals yields radiation force with different shapes and spectra. Using a sinusoidal modulation signal with either AM or DSB-SC AM yields spectra with different components and weighting of those components as predicted by the theory. When more complex modulating signals are used such as a square wave, a triangle wave, or a FM signal, the radiation force contains multiple frequency components. The magnitude of those components also changes and so different modulating signals could be used for different experiments based on the desired excitation.
We measured the cyclic velocity of a sphere induced by the multifrequency radiation force for different modulating functions. Using the velocity signals, we were able to estimate the viscoelastic properties of the gelatin in which the sphere was embedded. Figure 10 shows the fits using different modulation functions along with the reference measurement that was made using DSB-SC AM with a single sinusoid and varying the frequency. Using the triangle and FSK square waves seemed to produce results closest to the reference measurement, and the match was aided by the inclusion of more frequency components.
When linear interpolation was performed to achieve data with the same frequency resolution as the reference measurement, the fits matched better. The linear interpolation helped to compensate for frequency components that lacked significant SNR for certain modulating waveforms. For example, when using the square wave with 50% duty cycle [Fig. 10b], we only obtained components at 100, 300, 500,…, 1900 Hz, but the interpolation filled components at 200, 400, 600,…, 2000 Hz and improved the fitting. This was quantitatively evaluated and summarized in Table 1. In a majority of cases, interpolation helped to improve the fits to obtain values of μ1 and μ2 that were closer to those of the reference measurement made at single frequencies. In general the values for μ1 were in good agreement. The value of μ2 was more difficult to estimate consistently, probably because the shear viscosity was fairly low. The worst results were given with the AM chirp signal and that may be due to low SNR at any given frequency during the course of the chirp as opposed to the other waveforms used. A slower chirp could be used and may improve the results because more time would be taken at a given frequency.
We compared the measured sphere displacement and that derived from the theoretical development, and the agreement was very good. We take this result as a validation of the theory. We also observed that different modulation signals yielded similar estimates of μ1 and μ2. Using the data in Table 1, the median absolute percent errors in μ1 were 4.12% and 3.94% without and with interpolation, respectively, and the median absolute percent errors in μ2 were 21.54% and 16.56% without and with interpolation, respectively. The higher percent errors for μ2 result because of the low value of μ2. This agreement among material property estimates using different modulation signals would not be possible if the general theoretical basis was flawed. These results serve as an indirect validation as well as application of this multifrequency radiation force theory and method.
Modulating the ultrasound produces vibration with high SNR for a selected group of frequencies depending on the modulation function. The accuracy of the characterization of the viscoelastic properties of the gelatin material is dependent on the number of frequency components present and their respective weighting. Depending on the suspected material properties, one could choose one modulating signal versus another to optimize the ability to characterize the material. Either weighting at certain frequencies or desired bandwidth could be considered.
AM is probably the most versatile modulation technique while DSB-SC AM is also useful in creating modulated signals. FSK could be used for introducing codes into the radiation force if there was an application that necessitated this technique. FM could be used to distribute energy to a wide bandwidth. The modulation technique used for a given application depends on the way that the energy needs to be distributed in the forcing function.
One of the advantages of using modulation to produce a multifrequency radiation force is that one can obtain the same data in one measurement that the reference method took multiple measurements to obtain. The information gain can be quite high and the signal strength can be concentrated into known frequency components in the desired bandwidth through proper selection of the modulation function.
Two applications have arisen that utilize multifrequency radiation force to take advantage of obtaining information at multiple frequencies in one measurement. Vibro-acoustography has taken advantage of this multifrequency radiation force using DSB-SC AM waveforms to create multiple images from one scan.28 Another method called shear wave dispersion ultrasound vibrometry (SDUV) uses square wave modulation to transmit multiple tonebursts of ultrasound at the frequency of the square wave fr, and then elicits shear waves with components at harmonics of fr.25 The shear wave velocity is estimated at fr and several of its harmonics to estimate the shear wave velocity dispersion and characterize the viscoelastic material properties of the tissue or medium.
One could also design modulating functions to emphasize certain frequency components with specific weightings. That signal could be entered as an arbitrary waveform in hardware to be used for the analog modulation function.
CONCLUSION
In this paper we presented general theory for modulating ultrasound to produce multifrequency radiation force. We showed that using different modulation functions can create multifrequency radiation force with components at different frequencies and different relative weighting. As an example of the utility of using modulated ultrasound, we showed that this method could be used to characterize the viscoelastic properties of a tissue mimicking phantom material with differing degrees of accuracy based on the modulation function using one multifrequency measurement. Techniques such as SDUV and vibro-acoustography use these modulation techniques to perform noncontact, noninvasive characterization and imaging of materials and biological tissues.
ACKNOWLEDGMENTS
The authors are grateful to Randall Kinnick for hardware and experimental support, Tom Kinter for software and experimental support, and Jennifer Milliken for administrative support. M.W.U. is grateful to Dr. Shigao Chen for curve fitting procedure used for characterizing the gelatin phantoms and to Dr. Farid Mitri for helpful conversation. This work was supported in part by Grant Nos. EB002167, CA127325, CA91956, and CA121579 from the National Institutes of Health.
Portions of this work were presented in “Modulated ultrasound and multifrequency radiation force,” 154th Meeting of the Acoustical Society of America.
References
- Westervelt P. J., “Acoustic radiation pressure,” J. Acoust. Soc. Am. 29, 26–29 (1957). 10.1121/1.1908669 [DOI] [Google Scholar]
- Torr G. R., “The acoustic radiation force,” Am. J. Phys. 52, 402–408 (1984). 10.1119/1.13625 [DOI] [Google Scholar]
- Westervelt P. J., “The theory of steady forces caused by sound waves,” J. Acoust. Soc. Am. 23, 312–315 (1951). 10.1121/1.1906764 [DOI] [Google Scholar]
- Lee C. P. and Wang T. G., “Acoustic radiation pressure,” J. Acoust. Soc. Am. 94, 1099–1109 (1993). 10.1121/1.406957 [DOI] [Google Scholar]
- Beyer R. T., “Radiation pressure—The history of a mislabeled tensor,” J. Acoust. Soc. Am. 63, 1025–1030 (1978). 10.1121/1.381833 [DOI] [Google Scholar]
- Chu B. -T. and Apfel R. E., “Acoustic radiation pressure produced by a beam of sound,” J. Acoust. Soc. Am. 72, 1673–1687 (1982). 10.1121/1.388660 [DOI] [Google Scholar]
- Jiang Z. Y. and Greenleaf J. F., “Acoustic radiation pressure in a three-dimensional lossy medium,” J. Acoust. Soc. Am. 100, 741–747 (1996). 10.1121/1.416236 [DOI] [PubMed] [Google Scholar]
- Shou W. D., Huang X. W., Duan S. M., Xia R. M., Shi Z. L., Geng X. M., and Li F. Q., “Acoustic power measurement of high intensity focused ultrasound in medicine based on radiation force,” Ultrasonics 44, e17–e20 (2006). 10.1016/j.ultras.2006.06.034 [DOI] [PubMed] [Google Scholar]
- Fick S. E. and Breckenridge F. R., “Ultrasonic power output measurement by pulsed radiation pressure,” J. Res. Natl. Inst. Stand. Technol. 101, 659–669 (1996). [DOI] [PMC free article] [PubMed] [Google Scholar]
- Carson P. L., Fischella P. R., and Oughton T. V., “Ultrasonic power and intensities produced by diagnostic ultrasound equipment,” Ultrasound Med. Biol. 3, 341–350 (1978). 10.1016/0301-5629(78)90076-5 [DOI] [PubMed] [Google Scholar]
- Lee J. and Shung K. K., “Radiation forces exerted on arbitrarily located sphere by acoustic tweezer,” J. Acoust. Soc. Am. 120, 1084–1094 (2006). 10.1121/1.2216899 [DOI] [PubMed] [Google Scholar]
- Hasegawa T. and Yosioka K., “Acoustic-radiation force on a solid elastic sphere,” J. Acoust. Soc. Am. 46, 1139–1143 (1969). 10.1121/1.1911832 [DOI] [Google Scholar]
- Mitri F. G. and Chen S., “Theory of dynamic acoustic radiation force experienced by solid cylinders,” Phys. Rev. E 71, 016306 (2005). 10.1103/PhysRevE.71.016306 [DOI] [PubMed] [Google Scholar]
- Mitri F. G. and Fatemi M., “Dynamic acoustic radiation force acting on cylindrical shells: Theory and simulations,” Ultrasonics 43, 435–445 (2005). 10.1016/j.ultras.2004.10.003 [DOI] [PubMed] [Google Scholar]
- Crum L. A., “Acoustic force on a liquid droplet in an acoustic stationary wave,” J. Acoust. Soc. Am. 50, 157–163 (1971). 10.1121/1.1912614 [DOI] [Google Scholar]
- Marston P. L., “Shape oscillation and static deformation of drops and bubbles driven by modulated radiation stresses—Theory,” J. Acoust. Soc. Am. 67, 15–26 (1980). 10.1121/1.383798 [DOI] [Google Scholar]
- Chen S., Fatemi M., and Greenleaf J. F., “Remote measurement of material properties from radiation force induced vibration of an embedded sphere,” J. Acoust. Soc. Am. 112, 884–889 (2002). 10.1121/1.1501276 [DOI] [PubMed] [Google Scholar]
- Walker W. F., Fernandez F. J., and Negron L. A., “A method of imaging viscoelastic parameters with acoustic radiation force,” Phys. Med. Biol. 45, 1437–1447 (2000). 10.1088/0031-9155/45/6/303 [DOI] [PubMed] [Google Scholar]
- Nightingale K. R., Palmeri M. L., Nightingale R. W., and Trahey G. E., “On the feasibility of remote palpation using acoustic radiation force,” J. Acoust. Soc. Am. 110, 625–634 (2001). 10.1121/1.1378344 [DOI] [PubMed] [Google Scholar]
- Sarvazyan A. P., Rudenko O. V., Swanson S. D., Fowlkes J. B., and Emelianov S. Y., “Shear wave elasticity imaging: A new ultrasonic technology of medical diagnostics,” Ultrasound Med. Biol. 24, 1419–1435 (1998). 10.1016/S0301-5629(98)00110-0 [DOI] [PubMed] [Google Scholar]
- Fatemi M. and Greenleaf J. F., “Ultrasound-stimulated vibro-acoustic spectrography,” Science 280, 82–85 (1998). 10.1126/science.280.5360.82 [DOI] [PubMed] [Google Scholar]
- Fatemi M. and Greenleaf J. F., “Vibro-acoustography: An imaging modality based on ultrasound-stimulated acoustic emission,” Proc. Natl. Acad. Sci. U.S.A. 96, 6603–6608 (1999). 10.1073/pnas.96.12.6603 [DOI] [PMC free article] [PubMed] [Google Scholar]
- Bercoff J., Tanter M., and Fink M., “Supersonic shear imaging: A new technique for soft tissue elasticity mapping,” IEEE Trans. Ultrason. Ferroelectr. Freq. Control 51, 396–409 (2004). 10.1109/TUFFC.2004.1295425 [DOI] [PubMed] [Google Scholar]
- McAleavey S. A., Menon M., and Orszulak J., “Shear-modulus estimation by application of spatially-modulated impulsive acoustic radiation force,” Ultrason. Imaging 29, 87–104 (2007). [DOI] [PubMed] [Google Scholar]
- Chen S., Urban M., Pislaru C., Kinnick R., Zheng Y., Yao A., and Greenleaf J., “Shearwave dispersion ultrasound vibrometry (SDUV) for measuring tissue elasticity and viscosity,” IEEE Trans. Ultrason. Ferroelectr. Freq. Control 56, 55–62 (2009). 10.1109/TUFFC.2009.1005 [DOI] [PMC free article] [PubMed] [Google Scholar]
- Chen S., Silva G. T., Kinnick R. R., Greenleaf J. F., and Fatemi M., “Measurement of dynamic and static radiation force on a sphere,” Phys. Rev. E 71, 056618 (2005). 10.1103/PhysRevE.71.056618 [DOI] [PubMed] [Google Scholar]
- Silva G. T., Chen S., Greenleaf J. F., and Fatemi M., “Dynamic ultrasound radiation force in fluids,” Phys. Rev. E 71, 056617 (2005). 10.1103/PhysRevE.71.056617 [DOI] [PubMed] [Google Scholar]
- Urban M. W., Silva G. T., Fatemi M., and Greenleaf J. F., “Multifrequency vibro-acoustography,” IEEE Trans. Med. Imaging 25, 1284–1295 (2006). 10.1109/TMI.2006.882142 [DOI] [PubMed] [Google Scholar]
- Silva G. T., Urban M. W., and Fatemi M., “Multifrequency radiation force of acoustic waves in fluids,” Physica D 232, 48–53 (2007). 10.1016/j.physd.2007.05.004 [DOI] [Google Scholar]
- Mitri F. G., Greenleaf J. F., and Fatemi M., “Chirp imaging vibro-acoustography for removing the ultrasound standing wave artifact,” IEEE Trans. Med. Imaging 24, 1249–1255 (2005). 10.1109/TMI.2005.854518 [DOI] [PubMed] [Google Scholar]
- Erpelding T. N., Hollman K. W., and O'Donnell M., “Bubble-based acoustic radiation force using chirp insonation to reduce standing wave effects,” Ultrasound Med. Biol. 33, 263–269 (2007). 10.1016/j.ultrasmedbio.2006.07.039 [DOI] [PMC free article] [PubMed] [Google Scholar]
- Hu Y., Zhang D., Zheng H., and Gong X., “Chirp excitation technique to enhance microbubble displacement induced by ultrasound radiation force,” J. Acoust. Soc. Am. 125, 1410–1415 (2008). 10.1121/1.3075548 [DOI] [PubMed] [Google Scholar]
- Carlson A. B., Communication Systems: An Introduction to Signals and Noise in Electrical Communication (Irwin McGraw-Hill, Boston, MA, 1986). [Google Scholar]
- Urban M. W. and Greenleaf J. F., “Harmonic pulsed excitation and motion detection of a vibrating reflective target,” J. Acoust. Soc. Am. 123, 519–533 (2008). 10.1121/1.2805666 [DOI] [PubMed] [Google Scholar]
- Bracewell R. N., The Fourier Transform and Its Applications (McGraw-Hill, Boston, MA, 2000). [Google Scholar]
- Urban M. W., Kinnick R. R., and Greenleaf J. F., “Measuring the phase of vibration of spheres in a viscoelastic medium as an image contrast modality,” J. Acoust. Soc. Am. 118, 3465–3472 (2005). 10.1121/1.2130947 [DOI] [PubMed] [Google Scholar]
- Oestreicher H. L., “Field and impedance of an oscillating sphere in a viscoelastic medium with an application to biophysics,” J. Acoust. Soc. Am. 23, 707–714 (1951). 10.1121/1.1906828 [DOI] [Google Scholar]


