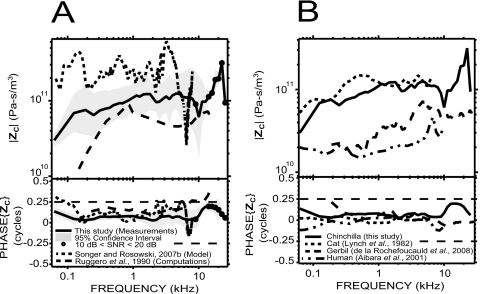
Figure 10.
Comparison of our measurements of ZC (solid lines) with other studies. (A) In chinchilla: comparison with the prediction of a model by Songer and Rosowski (2007a): dotted line and computations by Ruggero et al. (1990): dashed line, who used their own US measurements and Décory’s (1989)PV measurements in other animals [see Fig. 8A]. (B) In other mammals: comparison with studies in cat (from Lynch et al., 1982: dotted line), gerbil (from de La Rochefoucauld et al., 2008: dashed line), and human temporal bone (from Aibara et al., 2001: dashed-double dotted line).

