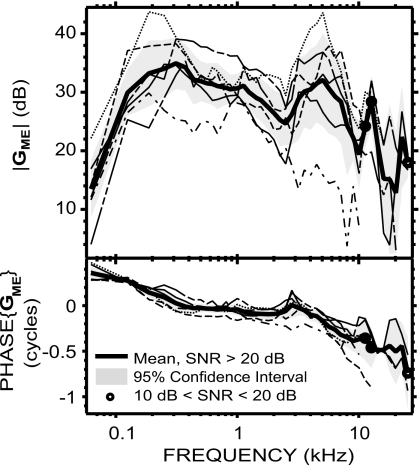
Figure 2.
GME in six animals (individual data: thin lines; mean: thick solid line; 95% CI: shaded areas). Data points with a SNR<10 dB were not included; frequencies for which SNR<20 dB in at least one of the individual data point were marked by a circle (see Sec. 2).

