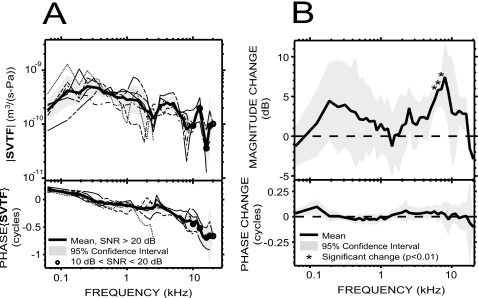
Figure 4. SVTF.
in six animals. (A) SVTF before the vestibular hole was made (individual data: thin lines; mean: thick solid line; 95% CI: shaded areas). (B) Mean effect of introducing the vestibular hole on SVTF in six animals. We computed the change in magnitude and phase before the hole was made and afterward with the pressure sensor in place. Changes in magnitude were significant (p<0.01) only in a small region around 6 kHz (asterisks).

