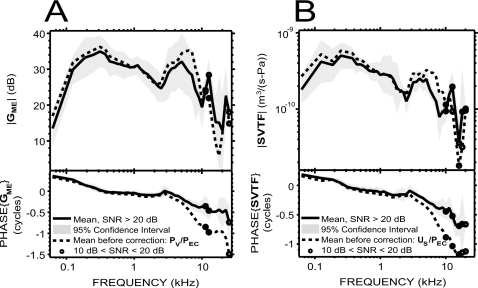
Figure 6.
Effect of an ear canal correction (to account for the differences between PEC and PTM—see Sec. 2) on GME and SVTF. (A) Mean GME before (dotted line) and after (solid line, from Fig. 2) correction. (B) Mean SVTF in the intact vestibule condition before (dotted line) and after [solid line, from Fig. 4A] correction.

