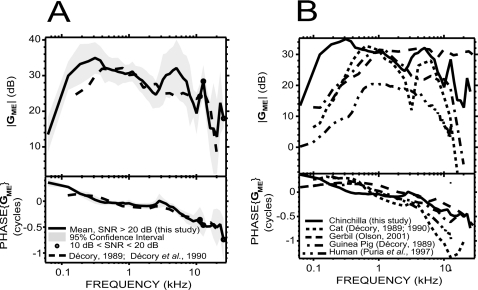
Figure 8.
Comparison of our measurements of GME (solid lines) with other studies. (A) In chinchilla: comparison with a previous study by Décory (1989) and Décory et al. (1990): dashed line. The two data sets were very similar at stimulus frequencies of 500 Hz–3 kHz and 12–20 kHz, but different at other frequencies. (B) In other mammals: comparison with studies in cat, guinea pig (from Décory, 1989 and Décory et al., 1990: dotted and dashed-dotted lines), gerbil (from Olson, 2001: dashed line), and human temporal bone (from Puria et al., 1997: dashed-double dotted line). All these measurements were carried out with open holes in the bullar walls. The septum of the middle ear (Møller, 1965; Huang et al., 1997) was intact in the cat study.

