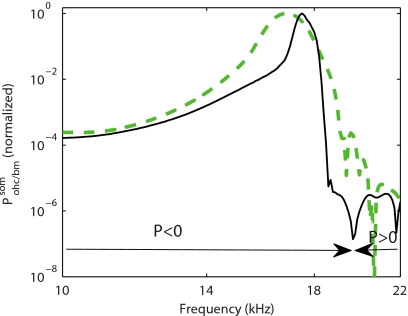
Figure 11.
Absolute value of the power of the OHC active (somatic) force on the BM normalized to the value at the CF. Thick dashed line: in the TM-LC model. Thin solid line: in the LR model. For both models the parameters are the same as in Fig. 2. The sign of the power (P in the figure) is indicated in the figure to show the frequency region where the OHC somatic forces add power to the BM and the frequency region where it removes power from the BM . For both models the OHC somatic force adds power to the BM for frequencies less than the CF and up to about 20 kHz.

