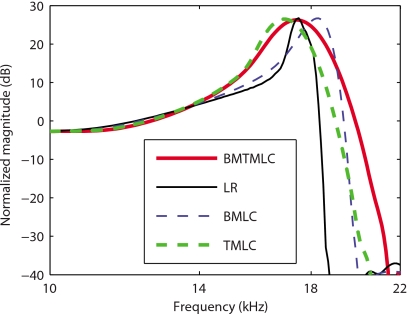
Figure 2.
Model predictions for the BM gain in the active case (80% activity). As in Ref. 19, the gain is normalized to the maximum passive model gain. Thin solid line: Active LR model response. Thick dashed line: Active TM-LC model response. Thin dashed line: Active BM-LC model response. Thick solid line: Active TMBM-LC model response. The values for ϵ3(x) for the different models are given in Table 3. The four models are capable of predicting realistic maximum gains but at these activity levels the Q10 dB for the LR and BM-LC models are always much higher than that predicted by the TM-LC and TMBM-LC models.

