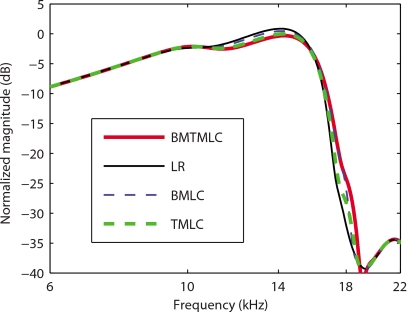
Figure 3.
Model predictions for the BM gain in the passive case (0% activity). As in Ref. 19, the gain is normalized to the maximum passive gain. Thin solid line: Passive LR model response. Thick dashed line: Passive TM-LC model response. Thin dashed line: Passive BM-LC model response. Thick solid line: Passive TMBM-LC model response. The effect of longitudinal coupling (in the BM or in the TM) is not significant on the passive BM frequency response.

