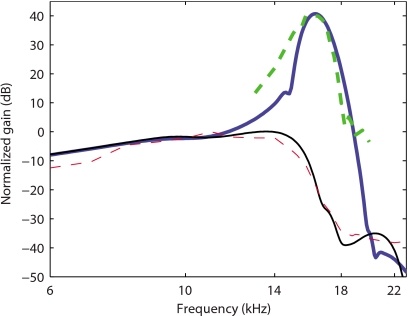
Figure 7.
Comparison of the TM-LC model response for the gain (G0=7 kPa, η=0.07 Pa s) with experimental data from Zheng et al. (Ref. 33). Solid lines: Model BM responses for 100% activity (thick line) and 0% activity (thin line). Dashed lines: Experimental data at 10 dB (thick line) and 100 dB SPL (thin line).

