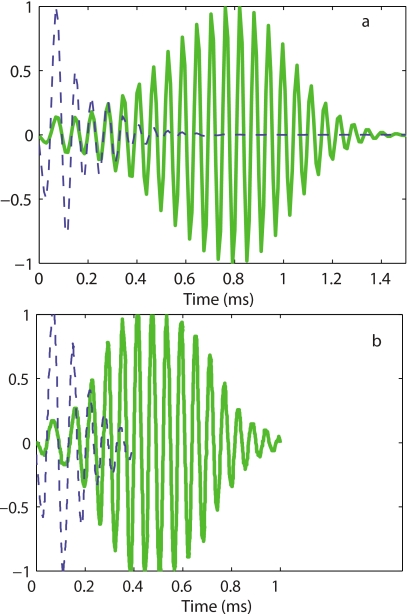
Figure 8.
Normalized theoretical and experimental impulse response functions. (a) TM-LC model impulse response. Dashed line: Passive response. Solid line: Active response (86% activity). (b) Normalized experimental BM impulse responses from de Boer and Nuttall (Ref. 37) at 10 dB SPL (solid line) and 100 dB SPL (dashed line).

