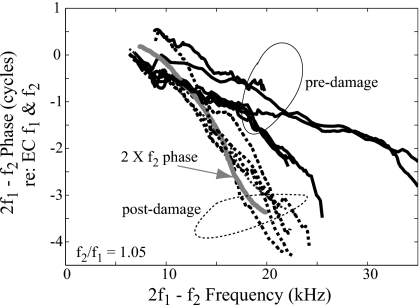
Figure 10.
DPOAE pre- and post-damage phases. Data from experiments wg91, wg92, wg93, wg95, wg122, and wg131. The 20 kHz region was damaged either by locally indenting the BM or by the invasive intracochlear measurement. Solid and dashed lines represent the phase under healthy and locally damaged conditions, respectively. The DPOAE shown is at frequency 2f1−f2 with L1=L2=80 or 90 dB and f2∕f1=1.05. The gray line shows an example of two times forward f2 phase with BF ∼20 kHz.

