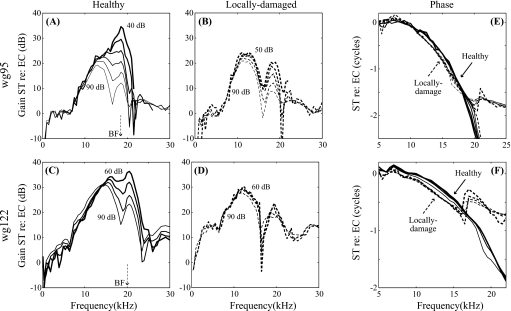
Figure 4.
Cochlear mechanics before and after local damage. Single-tone intracochlear pressure responses measured at the same location, close to the BM (∼10 μm) pre- and post-damage in two animals (wg95 and wg122). [(A) and (C)] Pre-damage gain relative to stimulus pressure in the ear canal; [(B) and (D)] Post-damage gain. Stimulus SPLs are labeled. [(E) and (F)] Single-tone pressure phase referenced to EC. Solid and dashed lines represent the cochlear conditions, healthy or locally damaged, respectively.

