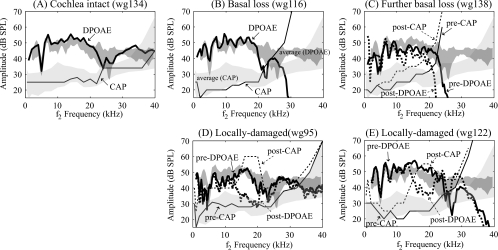
Figure 9.
Using DPOAE to gauge the cochlear condition (five animals). The darker gray bands display average DPOAE and the lighter gray bands the average CAP thresholds across eight animals with normal CAP thresholds. The width of the bands indicates the standard deviation. The lines show DPOAE and CAP results from individual animals. The thicker lines show DPOAE levels, with the solid line pre-damage and the dotted line post-damage. The thinner lines show the corresponding CAP thresholds curves, solid pre-damage, and dotted post-damage. The DPOAE shown is at frequency 2f1−f2 with L1=L2=80 dB, f2∕f1=1.25.

