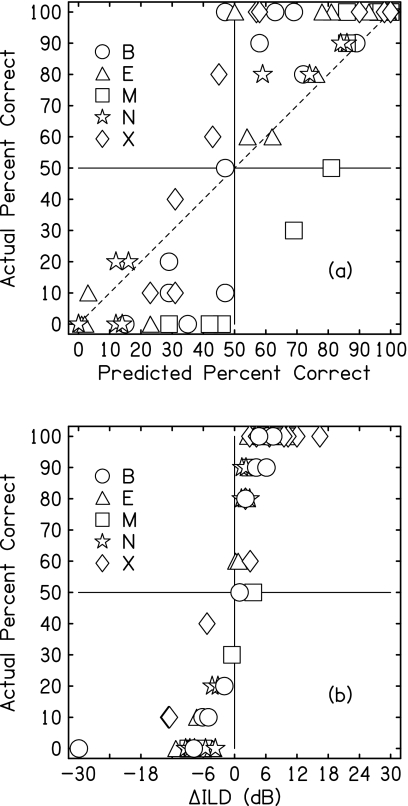
Figure 8.
Experiment 3, Discrimination. (a) The predicted percent correct and the actual percent correct are plotted against each other for the five listeners. Predicted values were based on individual identification data from Experiment 1. (b) Same as part (a) except that the actual percent correct is plotted against the change in ILD between the greater and lesser source numbers.

