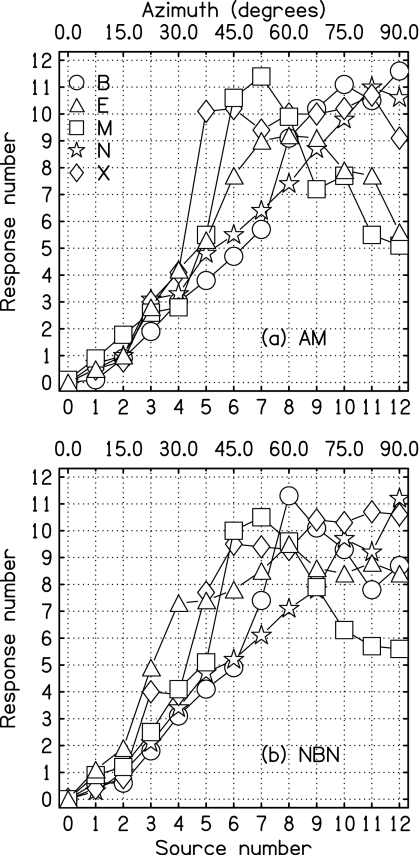
Figure 9.
(a) Experiment 4, AM: Listener identification responses on the scale 0–12 to sources as numbered on the horizontal axis for five listeners. The stimulus was a 1500-Hz sine tone amplitude modulated by a 100-Hz sine tone. (b) Experiment 5, NBN: Same as (a) except that the stimulus was a 200-Hz band of noise centered on 1500 Hz.

