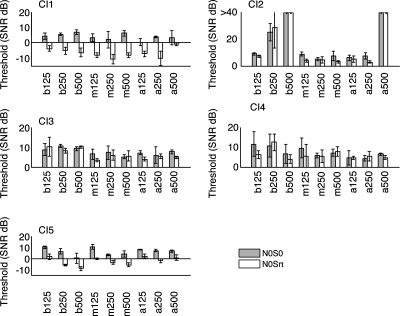
Figure 1.
Masking level thresholds for CI. Masking level thresholds are indicated by each bar. These indicate the smallest signal-to-noise ratio (in decibel) at which the subject was able to detect the signal in noise (see Sec. 2). Each group represents a different electrode pair and signal frequency condition. The labels designate the electrode pair (base∕middle∕apex) and stimulus condition (125∕250∕500 Hz). For example, a250 indicates apical pair of electrodes and stimulus condition of 250 Hz. In each group, the shaded bars represent the average of three trials from N0S0 while the unshaded bars designate the N0Sπ condition. The error bars represent standard deviation. For subject 2, some data points were truncated at 40 dB as the subject was unable to complete the signal detection task under those conditions.

