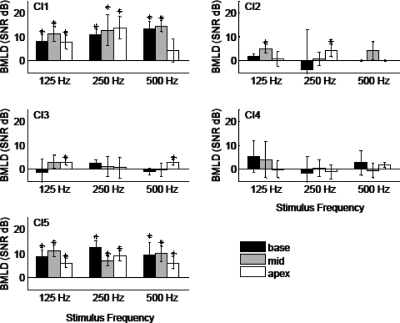
Figure 2.
Binaural masking level differences from five CI subjects. Each bar represents a BMLD value (y-axis) averaged over three trials, and is the mean difference of the N0S0 and N0Sπ thresholds in Fig. 1. BMLDs are grouped by stimulus condition along the x-axis. Data from different electrode pairs are indicated by the shading. The error bars represent the standard deviation. “∗” denote statistically significant BMLD values (unpaired t-test, p<0.05).

