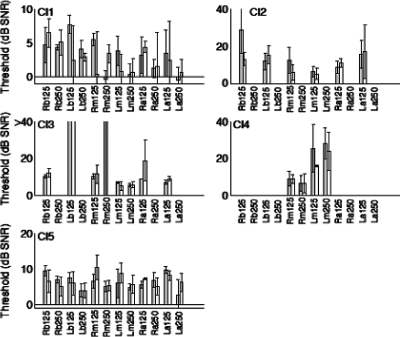
Figure 3.
Monoaural masking level thresholds. Format is similar to Fig. 1. The labels along the x-axis include “R” and “L” to specify right or left ear for the monaural condition. Note that some bars representing high threshold values were truncated (e.g., CI3).

