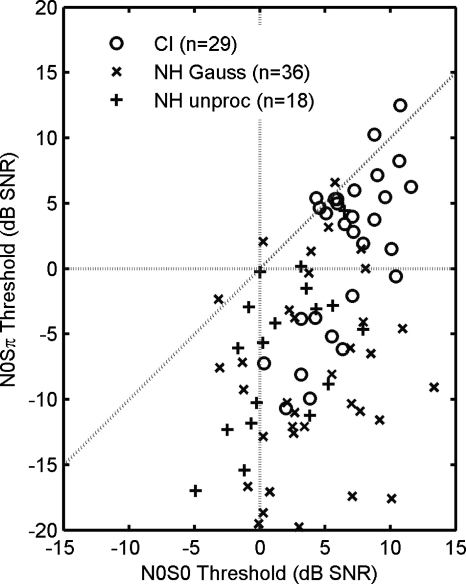
Figure 9.
Comparison of CI users to NH listeners with acoustic CI simulation. N0S0 thresholds are on the x-axis. N0Sπ thresholds are on the y-axis. Data points are from the 125 and 250 Hz stimulus conditions only. “O’s” are data from the five CI subjects. (Mean [N0S0; N0Sπ]=[6.6±2.8; 1.6±6.1] dB SNR.) “X’s” are data from six NH listeners using the Gaussian-enveloped tone vocoder. (Mean [N0S0; N0Sπ]=[4.0±4.1; −8.6±7.2] dB SNR.) “+’s” are data from six NH listeners with unprocessed stimuli. (Mean [N0S0; N0Sπ]=[1.6±3.5; −6.3±5.8] dB SNR.)

