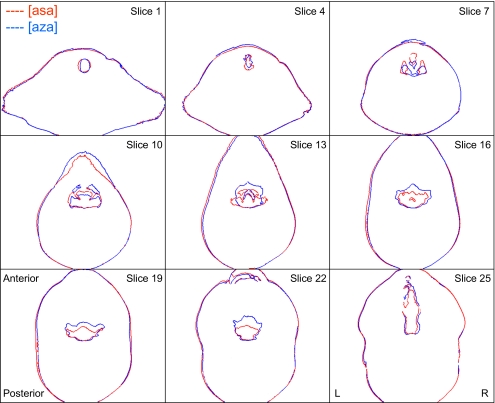
Figure 10.
Superimposition of axial slices to compare pharyngeal articulation—subject M1, tokens [asa] vs [aza]. Higher slice numbers correspond to higher positions in tract. Slice 1 (top left): trachea; slice 7: supraglottal slice showing piriform sinuses; slice 13: midpharynx and epiglottis; slice 25 (bottom right): oral cavity beneath hard palate.

