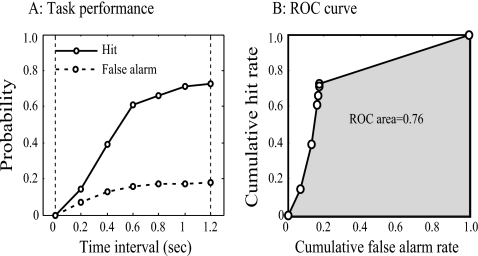
Figure 3.
Construction of ROC curve. (A) The probabilities for hit (solid line) and false alarm (dashed line) were independently computed at each of the time intervals from 0.0 to 1.2 s with 0.2 s increments following the onset of the response window after the target and reference. The vertical dashed lines indicate the start and the end of the response window. (B) The false-alarm probability function was plotted against hit probability function to construct the ROC curve (solid line). The area under the ROC curve (shaded area) was a measure of discriminative performance of the task.

