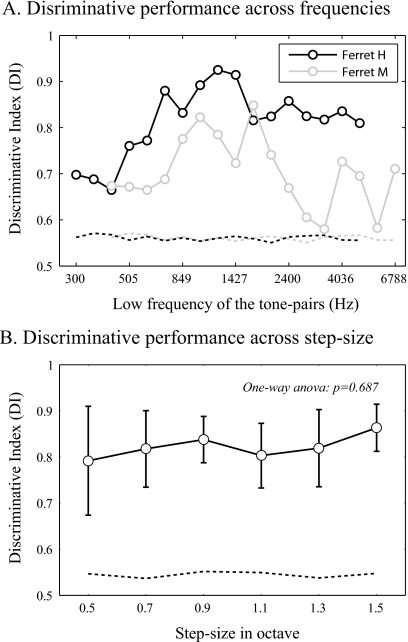
Figure 6.
Discriminative performance across frequencies and step-sizes of the tone-pairs. (A) Phase-3 data sets were the same as used in Fig. 4 for both ferrets M and H. The trials from all of those ten sessions were pooled together to compute the discriminative index for each of the tone-pairs. The significant discriminative performances were confirmed at all the tone-pairs within four-octave training frequency range. (B) Discriminative index at each frequency separation is represented as mean±standard deviation (N=6). There is no significant difference in discriminative performance across the frequency separations between the component tones of the sequence. The horizontal dashed lines in (A) and (B) indicate the baseline performance (mean plus two standard deviation of the shuffled-DIs). A DI value above those dashed lines indicates a significant discriminative performance.

