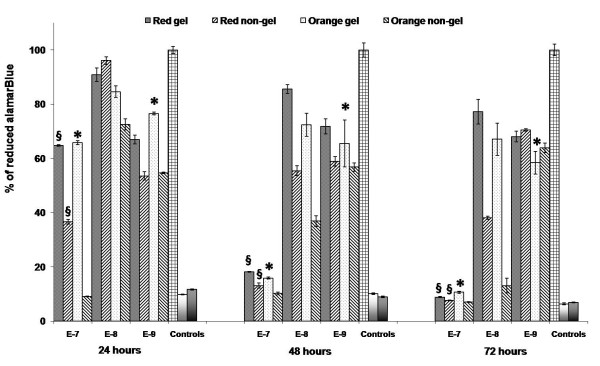
Figure 10.
AlamarBlue histograms. AlamarBlue assay at 24, 48 and 72 hours showing the viability of PC12 cells after treatment with varying concentrations [10[[(-7)-(-9)] M] of the gel and non-gel QDs. From left to right, controls [positive, negative, background] are also shown. §denotes examples of statistical significance due to effect of gelatine, * denotes examples of statistical significance due to effect of concentration using a one- way ANOVA (p < 0.05) by Tukey's mean comparison.

