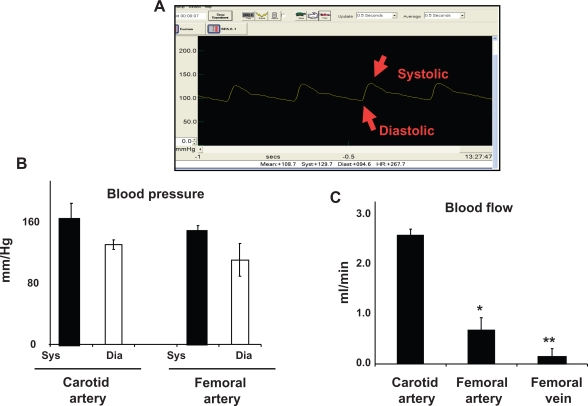
Figure 1.
Arterial blood pressure and blood flow. A) A typical femoral arterial wave showing systolic and diastolic peaks. A PE-50 catheter was inserted into femoral artery. B) Bar graphs showed the systolic (sys) and diastolic (dia) blood pressure, measured in the carotid and femoral arteries. C) Bar graphs showed blood flow in different vascular beds.
Notes: Data represents mean ± SE, n = 5. * and ** indicate P < 0.05 versus carotid artery.

