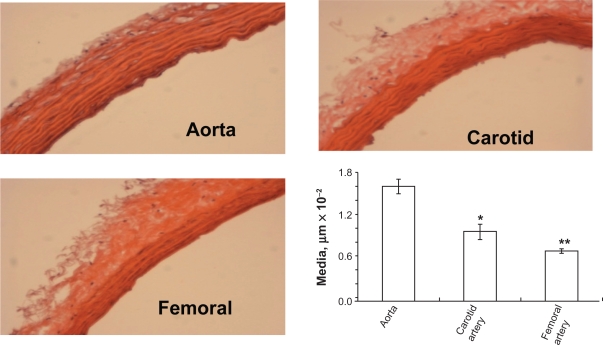
Figure 2B.
Hematoxylin and eosin staining of different arteries. H and E staining of different arteries was done to determine the structural differences between the arteries. The aorta showed the highest medial thickness and the femoral artery showed lowest medial thickness when compared with the other two arteries. The bar graphs represent the differential medial thickness of the arteries.
Notes: Data represent mean ± SE, n = 5; * and ** indicates P < 0.05 versus aorta.

