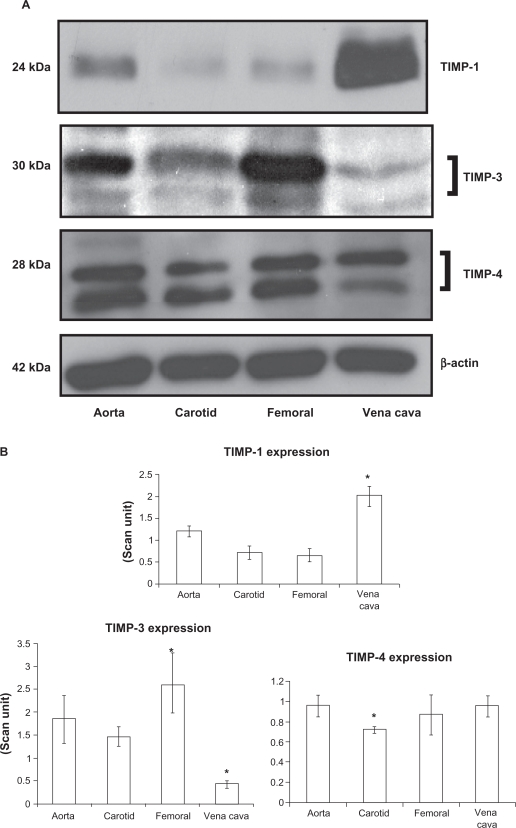
Figure 5.
Differential expression of TIMPs in vascular beds. A) Western blot analysis. B) Bar graphs of scanned intensity values. The TIMP-1 protein was detected at higher levels in the vena cava, whereas TIMP-3 was found at lower levels compared with other vessels. TIMP-4 was detected at lower levels in the carotid artery. The bar diagram shows densitometric analyses of TIMP protein.
Notes: Data represent mean ± SE, n = 5; * indicates P < 0.05 vs. aorta.

