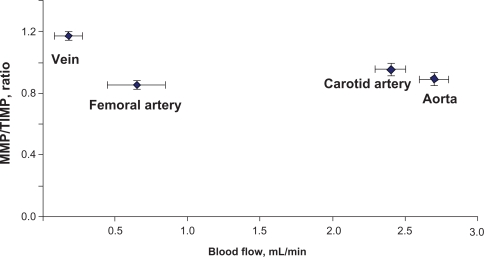
Figure 5 C.
Relationship between MMP:TIMP ratio and the blood flow. In order to get the MMP:TIMP ratio, averaged scanned data of MMPs in each of the blood vessels was calculated and divided by the averaged scanned units of TIMPs from the blood vessel. MMP:TIMP ratio was plotted in the y axis and the blood flow was plotted in the x axis. The vena cava has the highest MMP:TIMP ratio and the lowest blood flow in comparison with the other blood vessels.

