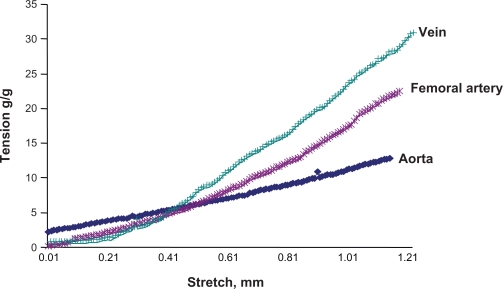
Figure 6.
Passive stretch-tension relationship between different vascular beds. A stretch-tension relationship was obtained by increasing the stretch 0.001 mm at a time. The resulting tension was plotted in the y axis, and the stretch was plotted in the x axis. The vena cava showed the maximum response to the stretch, because this blood vessel has the minimum elastin and maximum amount of collagen, whereas the aorta showed the minimum response to that, because this blood vessel has the maximum amount of elastin and minimum amount of collagen among the studied arteries.

