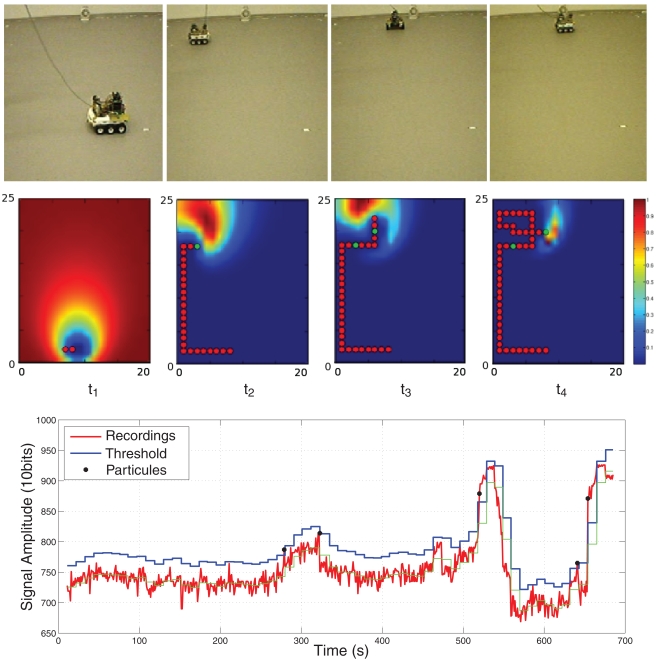
Figure 1.
Robot infotaxis in action. Top: Snapshot of the robot at particular times during its path. Middle: Corresponding source distribution maps (belief functions). The blue (resp. red) color code corresponds to low (resp. high) probabilities. The path of the robot from start to current time is superimposed to the map as consecutive red dots when there is no detection, a green dot indicating a detection. Wind blows downwards. The source is at location (9,24), the robot starting point is (10,2). Bottom: Detection procedure. The sensor signal, recorded at 10 Hz during the robot path, is shown in red. An adaptive detection threshold, in blue, is derived from the smoothing average, in green. The five detected patches are indicated as black dots.

